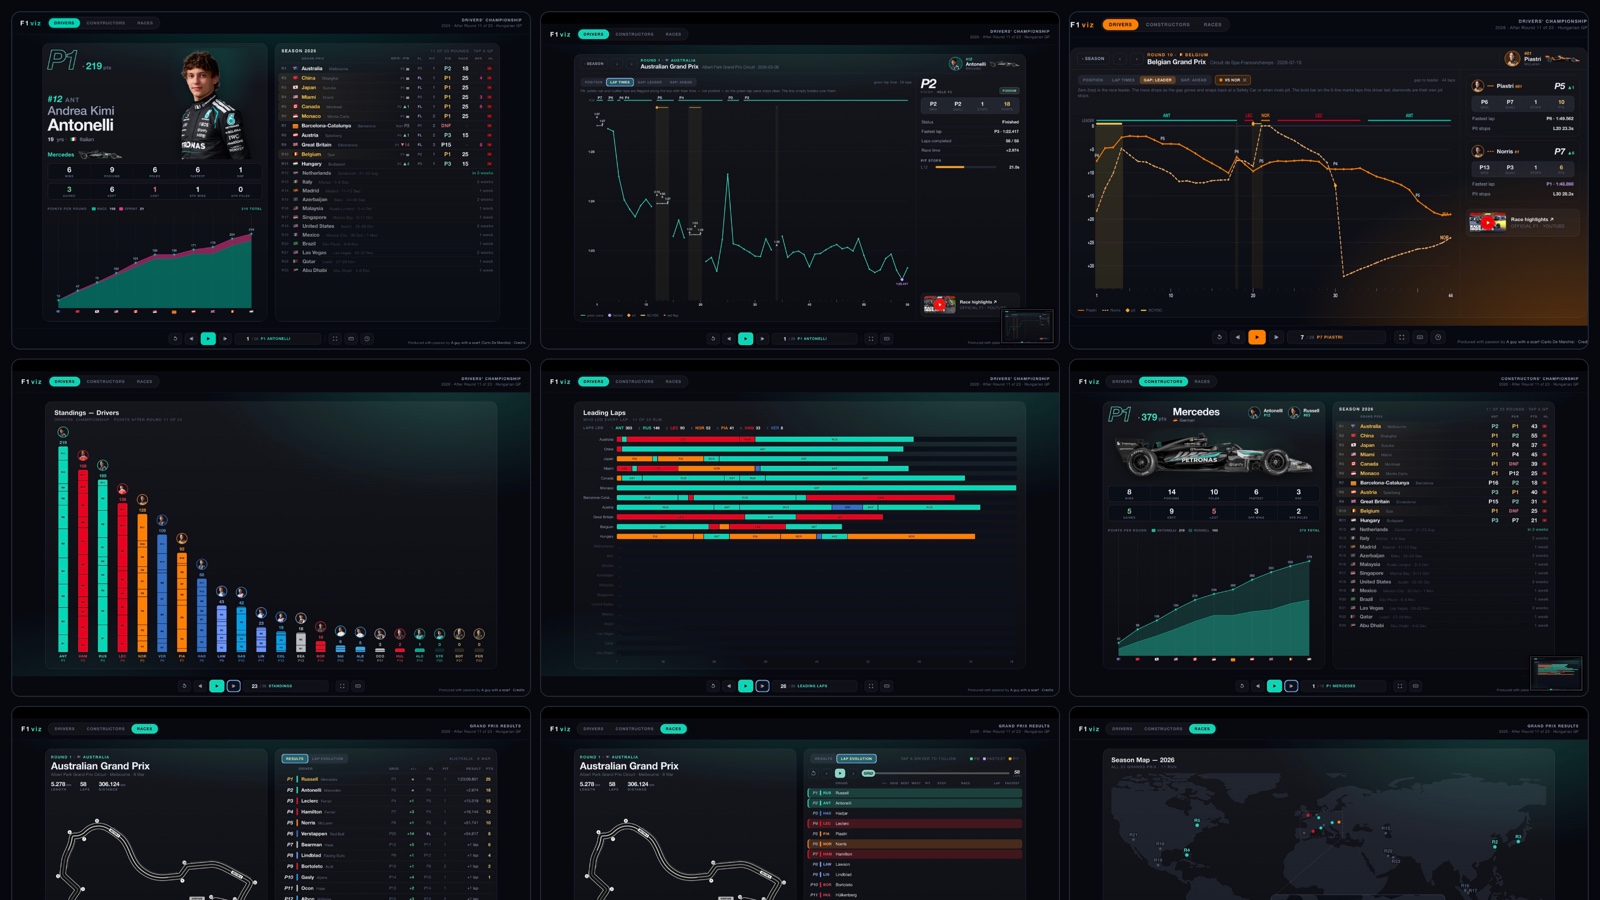
F1viz turns the 2026 season into a set of cards you flip through — one film for the Drivers, one for the Constructors, one for the Races. Every card is a small data-story you can read at a glance or dig into. This guide walks through every screen and every marker.
Best on a wide screen. F1viz is designed for landscape on a laptop or tablet — that's where the charts, the side-by-side panels and the season films have room to breathe, and where it's meant to be read. It works on a phone too, with everything stacked into one column — there's a look at the mobile layout at the bottom of this guide.
01 · Getting around
Three films, one control bar
The three tabs at the top — Drivers, Constructors, Races — each open a film of cards. Everything else you do from the control bar along the bottom.
◀ / ▶| — previous / next card.
▶ Play — auto-advance through the film hands-free (press again to pause).
↻ Restart — jump back to the first card of the film.
The counter (e.g. 5 / 26 · P5 Norris) — click it to open a jump menu and hop straight to any card.
⛶ Fullscreen — great for presenting on a big screen (hidden on phones).
⌨ Shortcuts — shows the keyboard cheatsheet.
Keyboard:←→ flip cards · Enter open the selected Grand Prix · Esc step back.
Inside a race deep-dive, ↑↓ jump to the previous / next race. On a phone:swipe left / right to change cards, and tap a Grand Prix row to open its race view. Layouts stack automatically.
02 · The Drivers film
The driver card
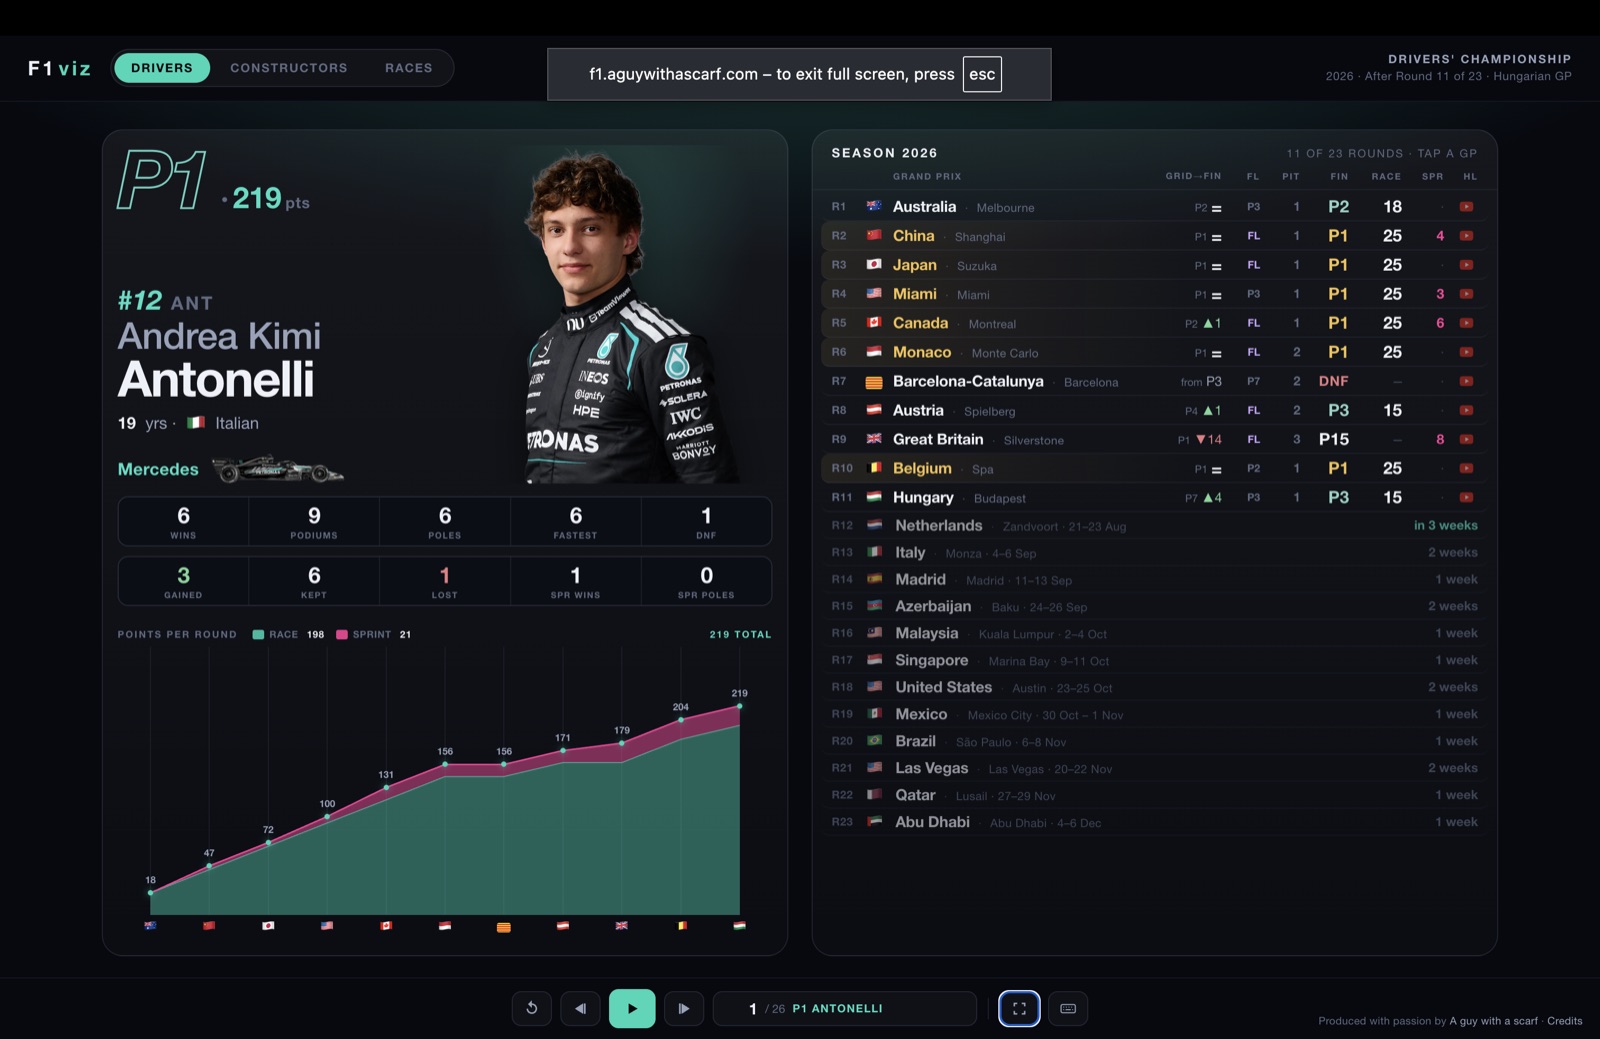
Each driver gets one card, ordered by championship position. The left half is the driver; the right half is their whole season, round by round.
Left: championship position + points, driver identity, and season tallies (wins · podiums · poles · fastest laps · DNFs, then places gained / kept / lost and sprint results), with a points-per-round chart. Right: every round — grid→finish, fastest lap, pit stops, finish, race & sprint points, and a highlights link.
The bars in the points chart split race vs sprint points, and the flags along the bottom mark each round. On the right, tap any Grand Prix row to open that race's deep-dive.
03 · Race deep-dive
Four ways to read a race
Tapping a Grand Prix opens the driver's race in full width. The whole view recolours to the driver's team, and four tabs give four angles on the same race. The panel on the right always summarises the result.
PositionLap timesGap: leaderGap: ahead
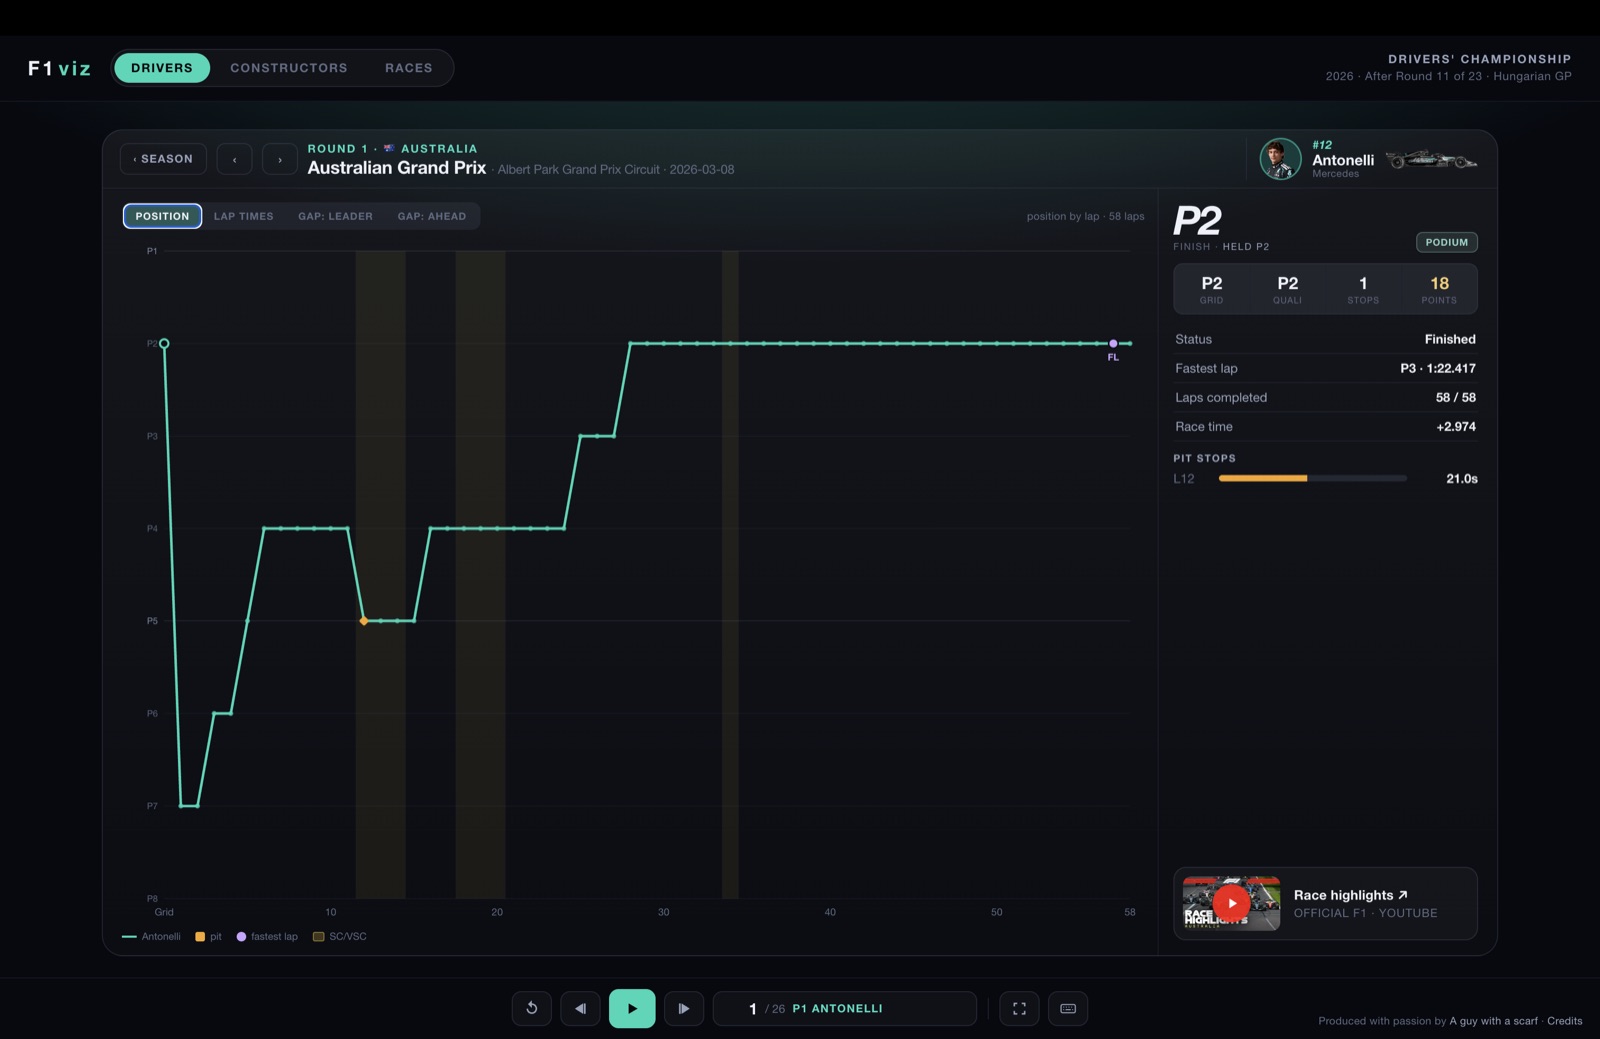
Position — where they ran, lap by lap
The line is track position over the race. Pit stops are amber diamonds, Safety-Car / VSC windows are shaded bands, the purple dot is the driver's fastest lap, and a dashed tail reconciles to the classified finish when a penalty or a lap down changed it.
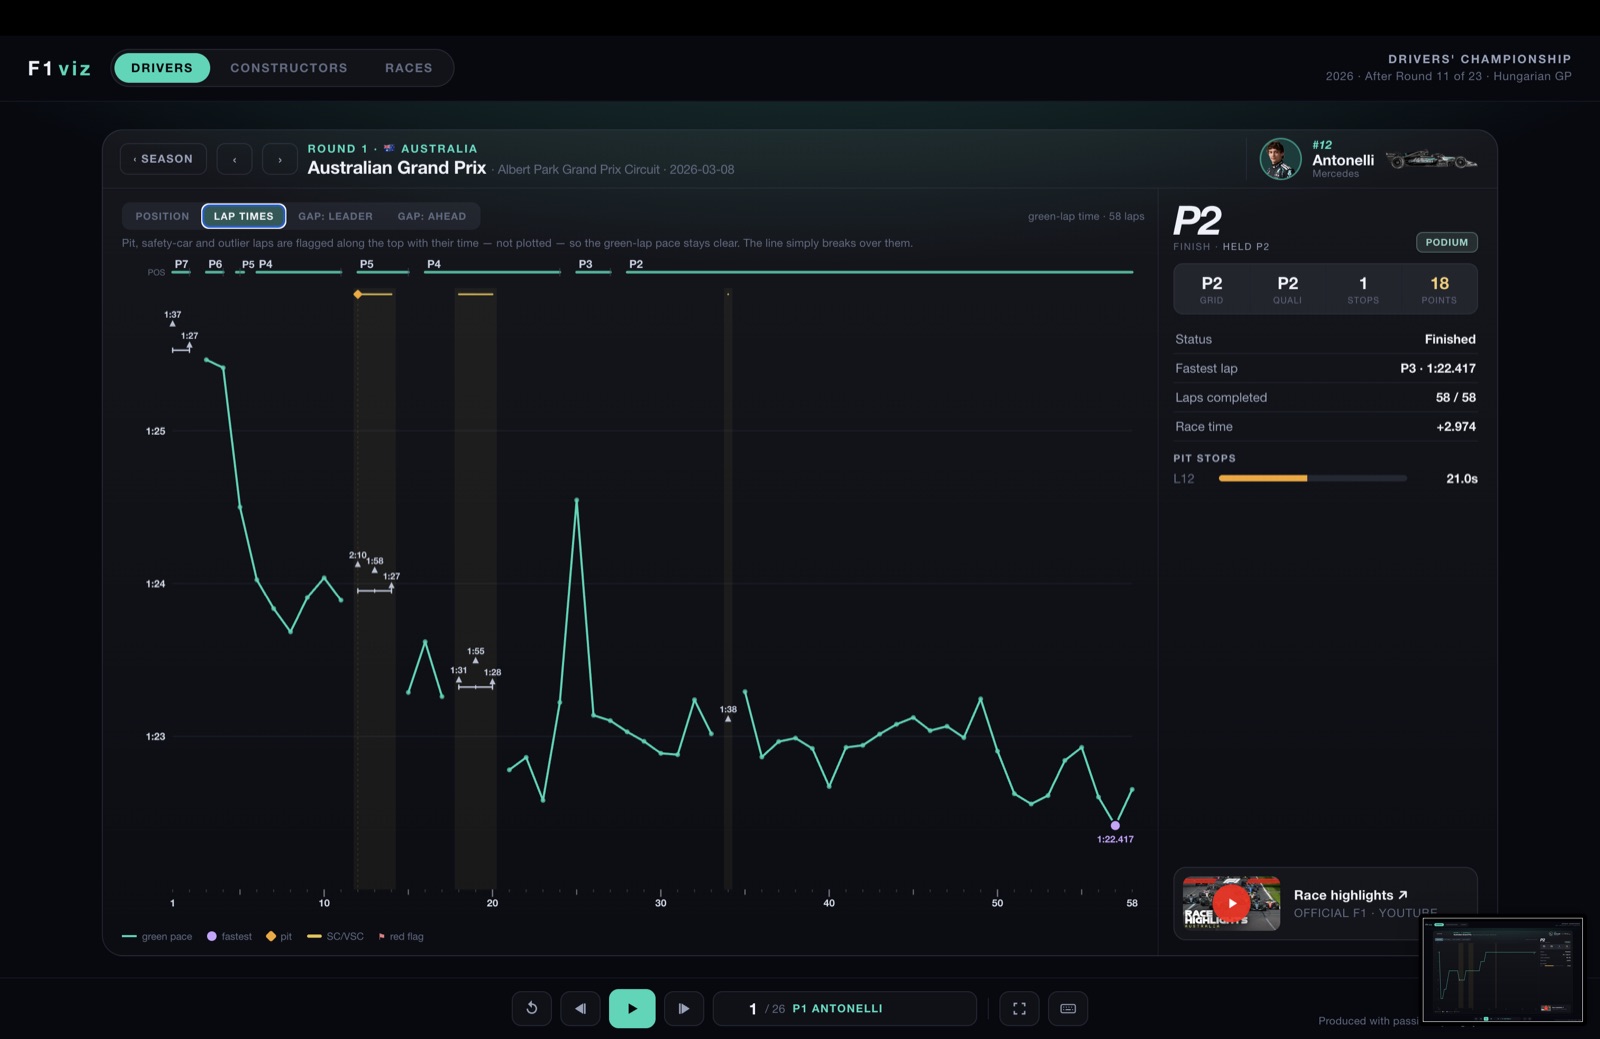
Lap times — the green-lap pace
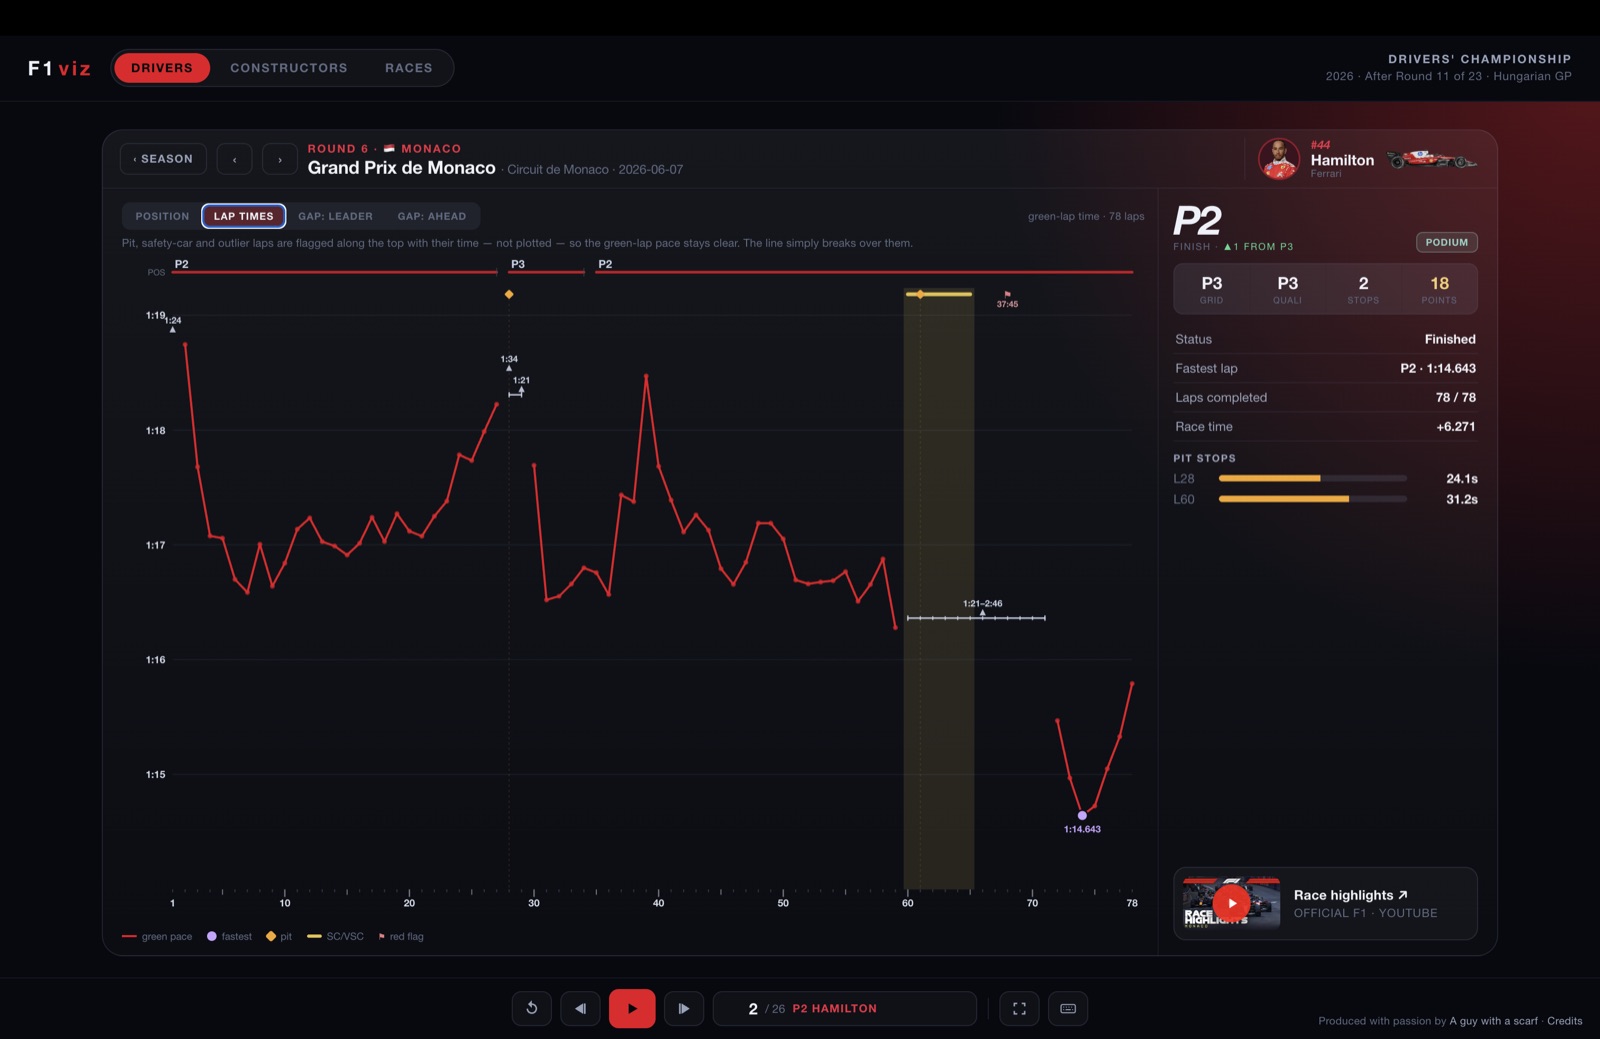
Only clean “green” laps are plotted (lower = faster). Pit, Safety-Car and outlier laps aren't drawn — they're flagged along the top with their time so the pace line stays readable and simply breaks over them. A POS track runs across the top showing the driver's position through the race.
Gap: leader & Gap: ahead
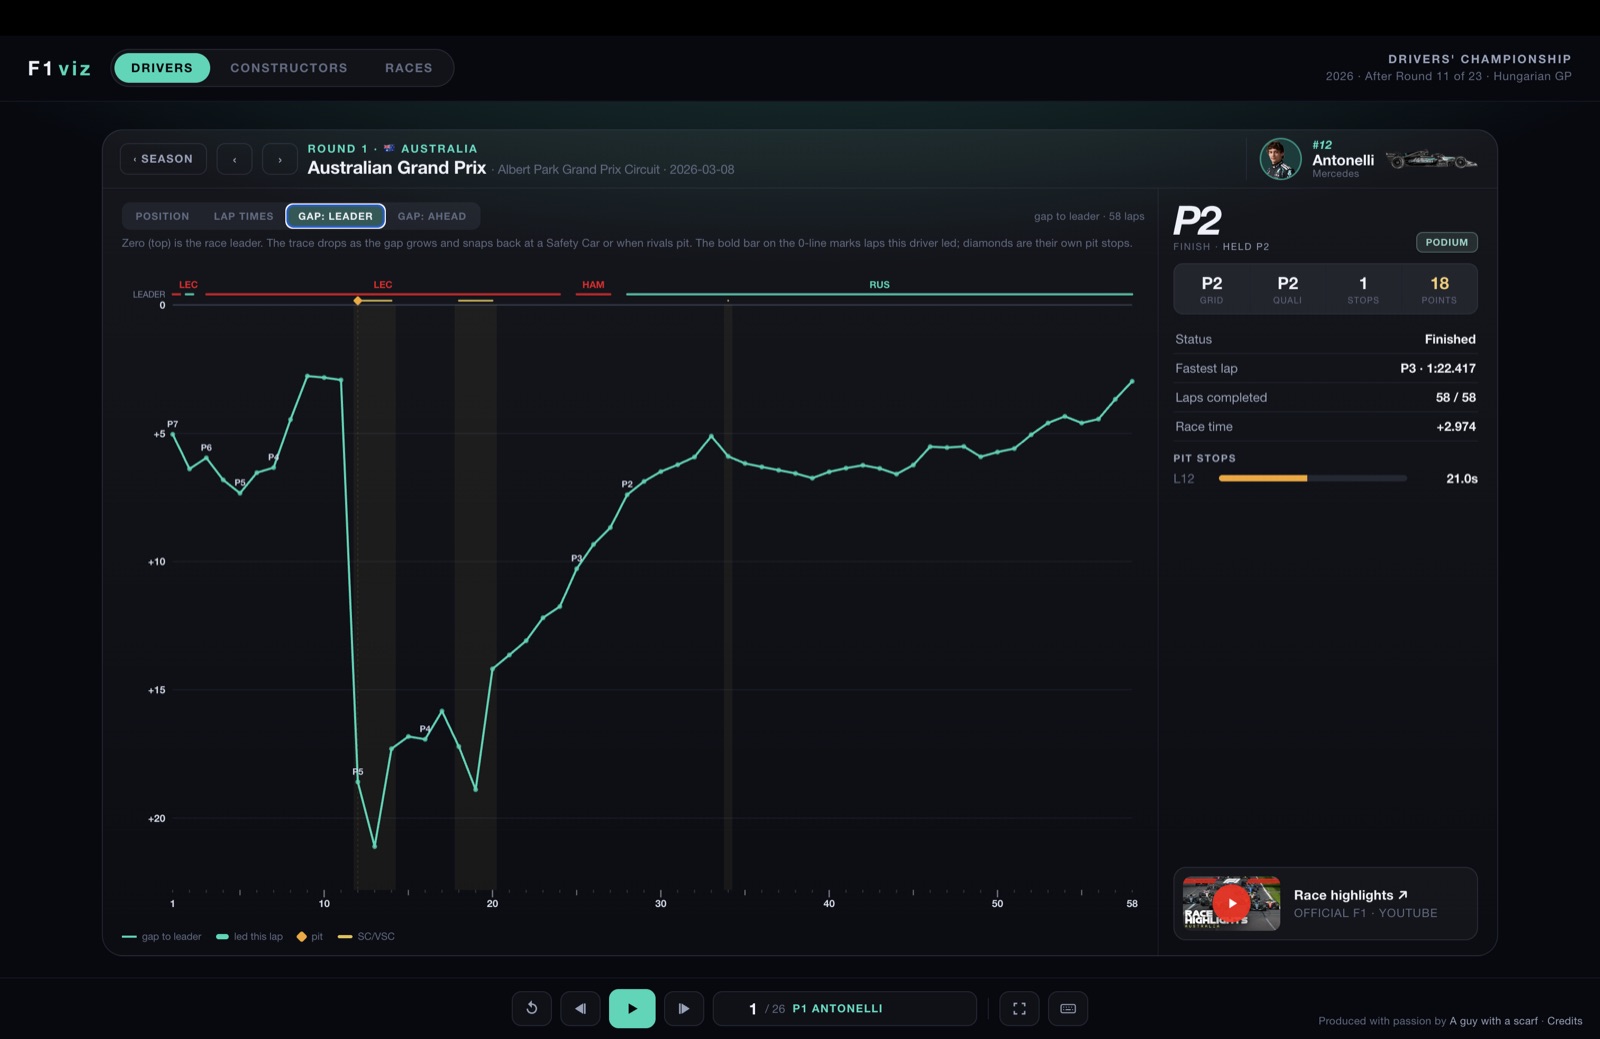
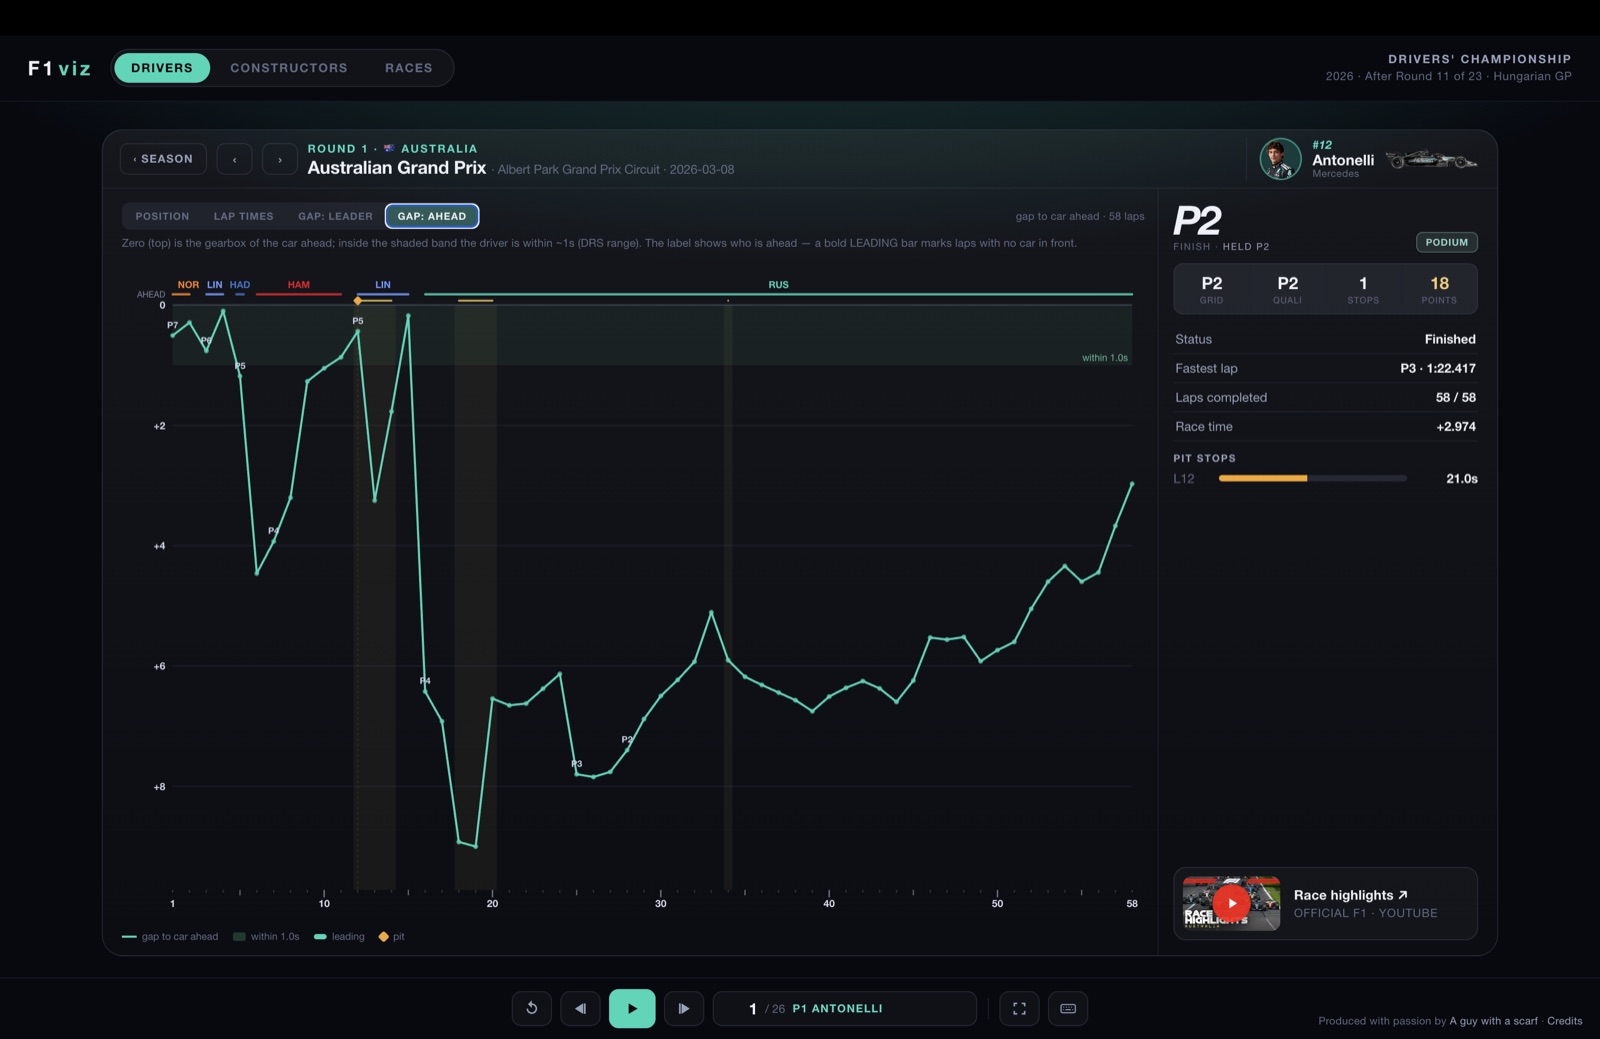
These two plot time gaps built from every car's cumulative lap times. Zero is the top line. The trace drops as the gap grows and snaps back at a Safety Car or when rivals pit.
Gap: leader — distance to whoever leads the race. The top reference lane names the leader (team-coloured) and a bold bar on the 0-line marks laps this driver led.Gap: ahead — distance to the car directly in front. Inside the shaded band the driver is within ~1s (DRS range); the label shows who's ahead, and a bold LEADING bar marks laps with no car in front.
The result panel
On the right: the finish (gold for a win, red for a DNF) and the move from grid, then grid · quali · stops · points, status, fastest lap, laps led, laps completed, race time, a pit-stop timeline (slow stops flagged), and a link to the official race highlights.
Every team, its own colours
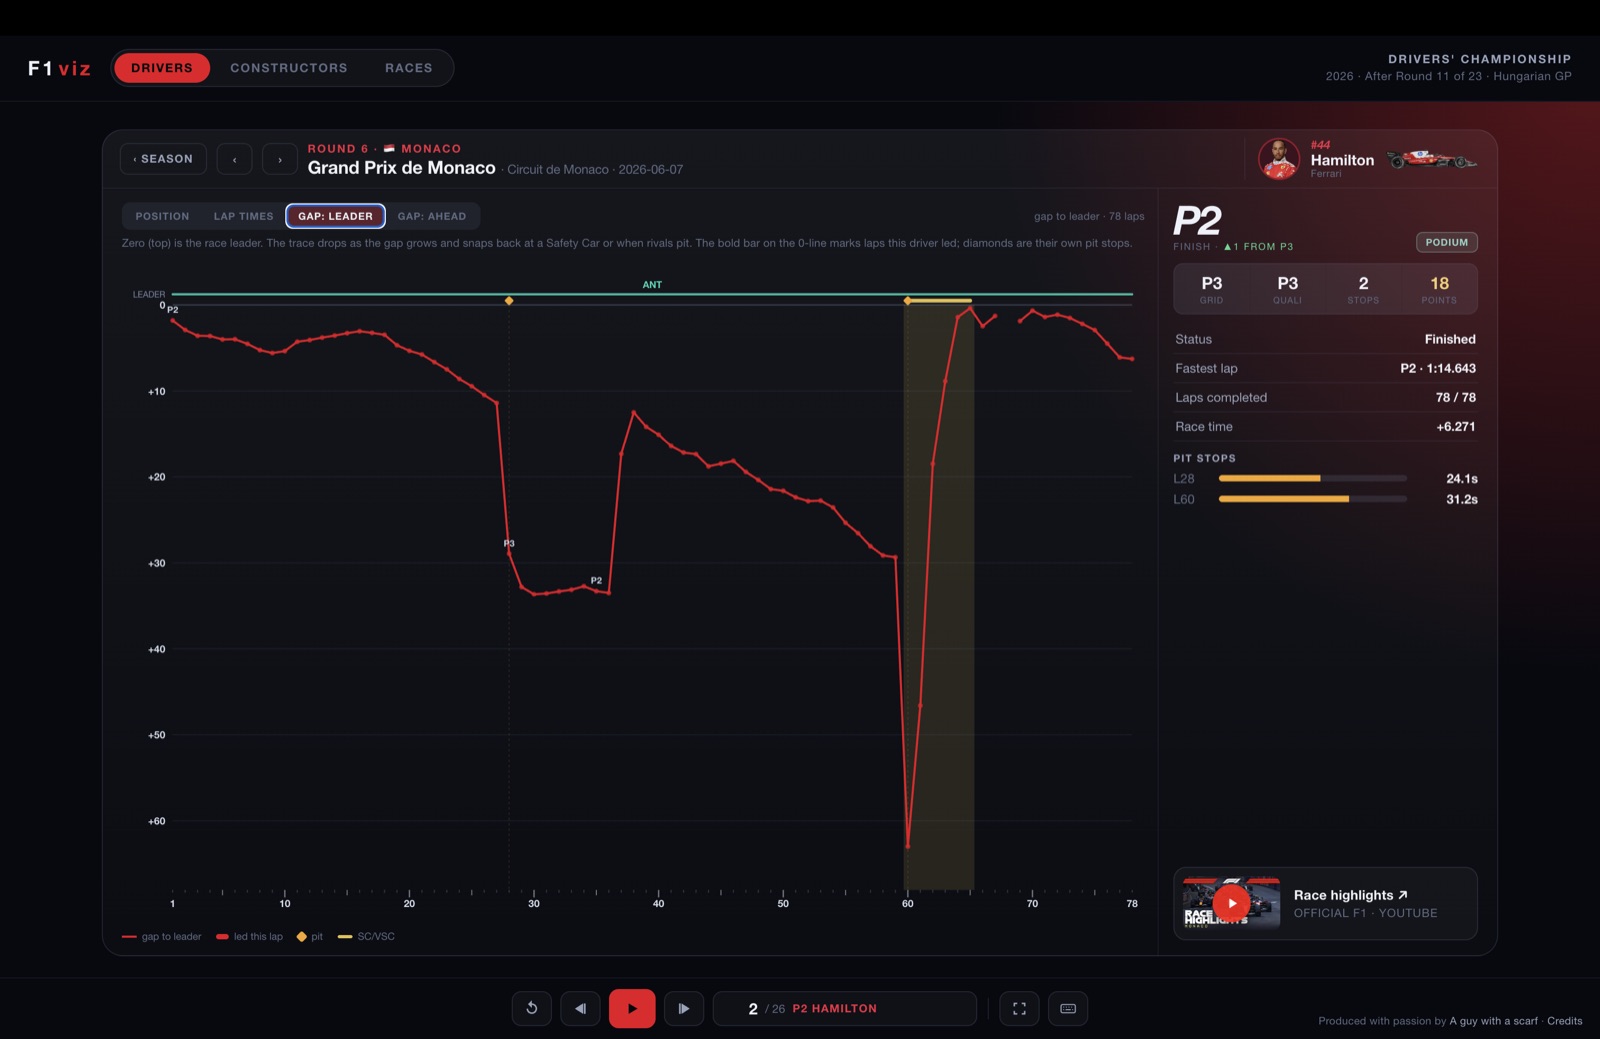
Open a different driver and the whole app repaints — here Hamilton's Ferrari red. The charts also handle the messy races cleanly:
Monaco's red-flag stoppage: the ~37-minute “lap” is shown as a red ⚑ marker (not plotted), and dense flagged zones collapse to a single min–max range with a lap tick-line.On the gap charts the same events show as big swings — the field bunches back up under a Safety Car or red flag, then stretches out again at the restart.
Compare two drivers
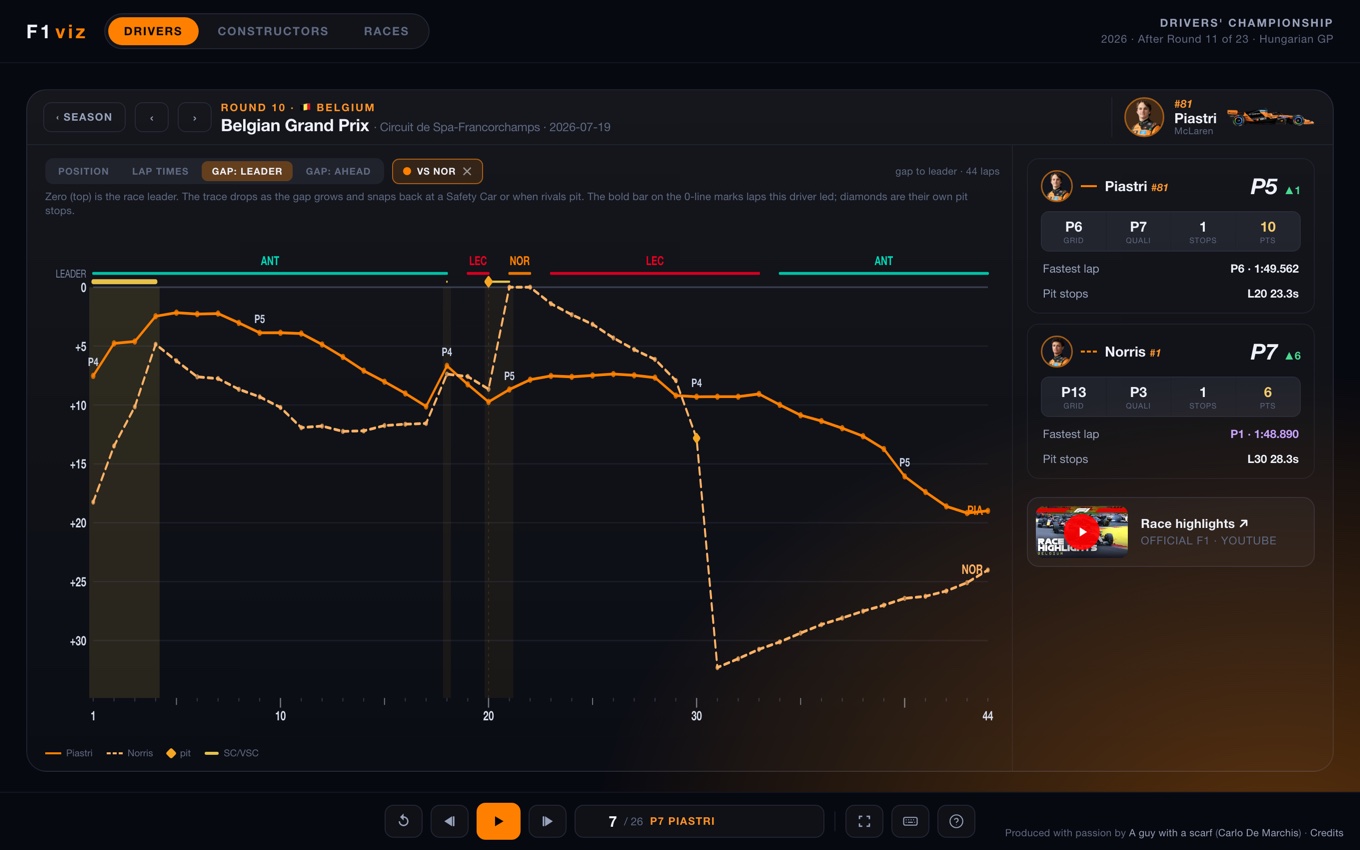
Hit + Compare next to the tabs and pick a driver — their teammate is offered first, then the cars that finished nearby. The chart overlays them — your driver solid, the rival dashed in their own colour, with code labels — and the right panel splits into two result boxes. It works on Position, Lap times and Gap: leader; the ✕ on the pill drops back to one. The comparison follows you from race to race, and the link stays shareable.
Compare — Piastri (solid) vs Norris (dashed), gap to the leader at Spa: Norris starts ~18s back, briefly leads, pits (the plunge to +31s), then recovers — with both drivers' results side-by-side.
04 · Reading the charts
Every marker, decoded
The same visual language runs across all the race charts:
Pit stopAmber diamond, on the top line — one per stop.
Safety Car / VSCYellow line at the top + a shaded band over those laps.
⚑Red flagA stoppage — its huge “lap” is flagged, never plotted.
Fastest lapPurple dot at the driver's quickest lap.
DNFRed marker where a retirement ends the line.
LeadingA bold bar (in the driver's colour) on the 0-line = laps led.
Within 1.0sShaded band on “gap to ahead” = DRS range.
POS trackTop line on the pace chart — position, labelled where it changes.
05 · Season summaries
The four closing cards
After the individual cards, each film ends with four whole-season views.
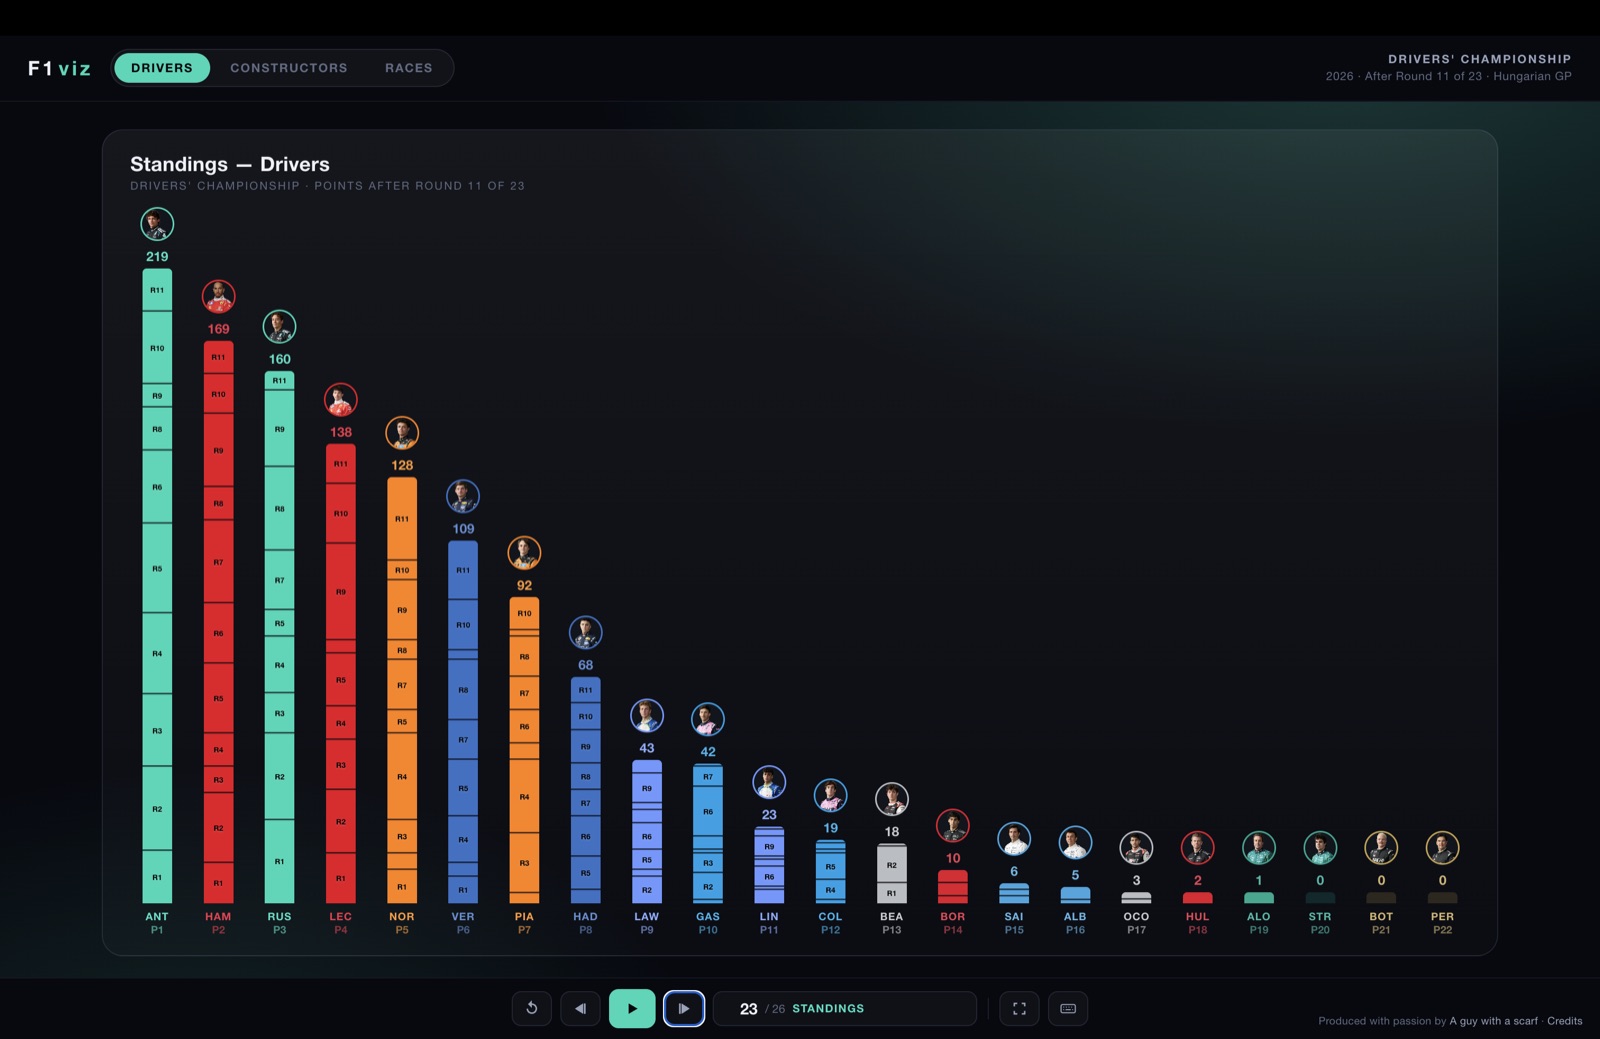
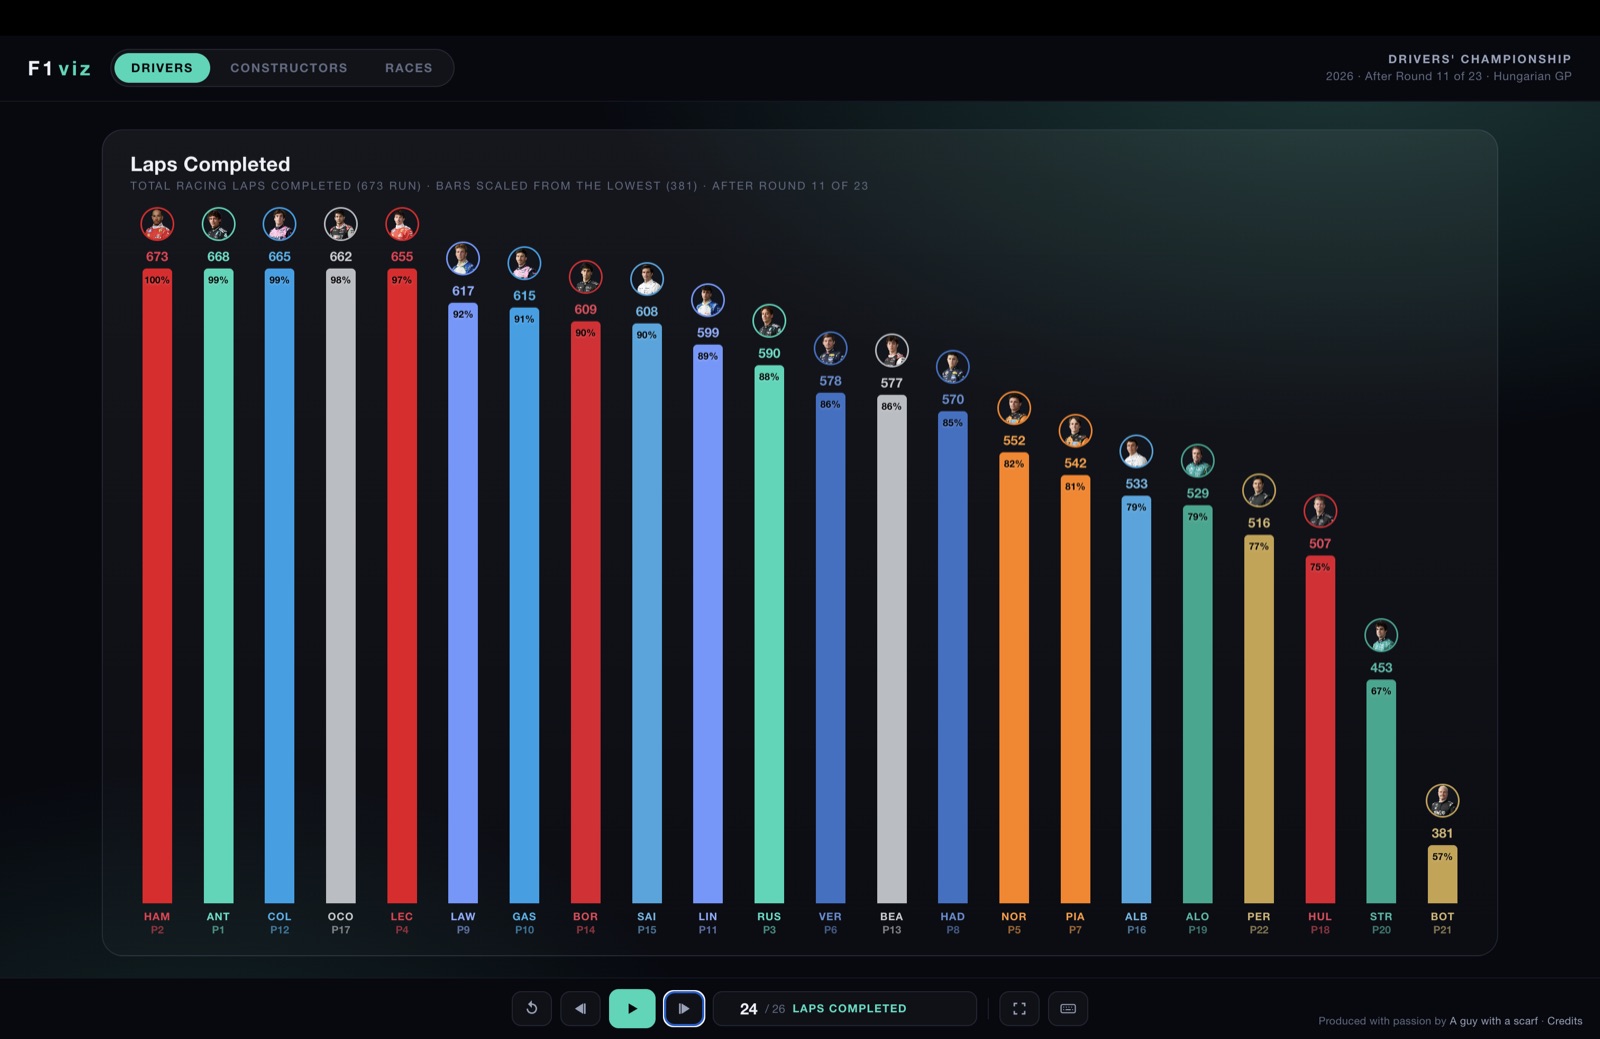
Standings — the championship as stacked bars, each block a round's haul. Tap a bar to jump to that driver.Laps completed — total racing laps run, a quick read on reliability and race distance.
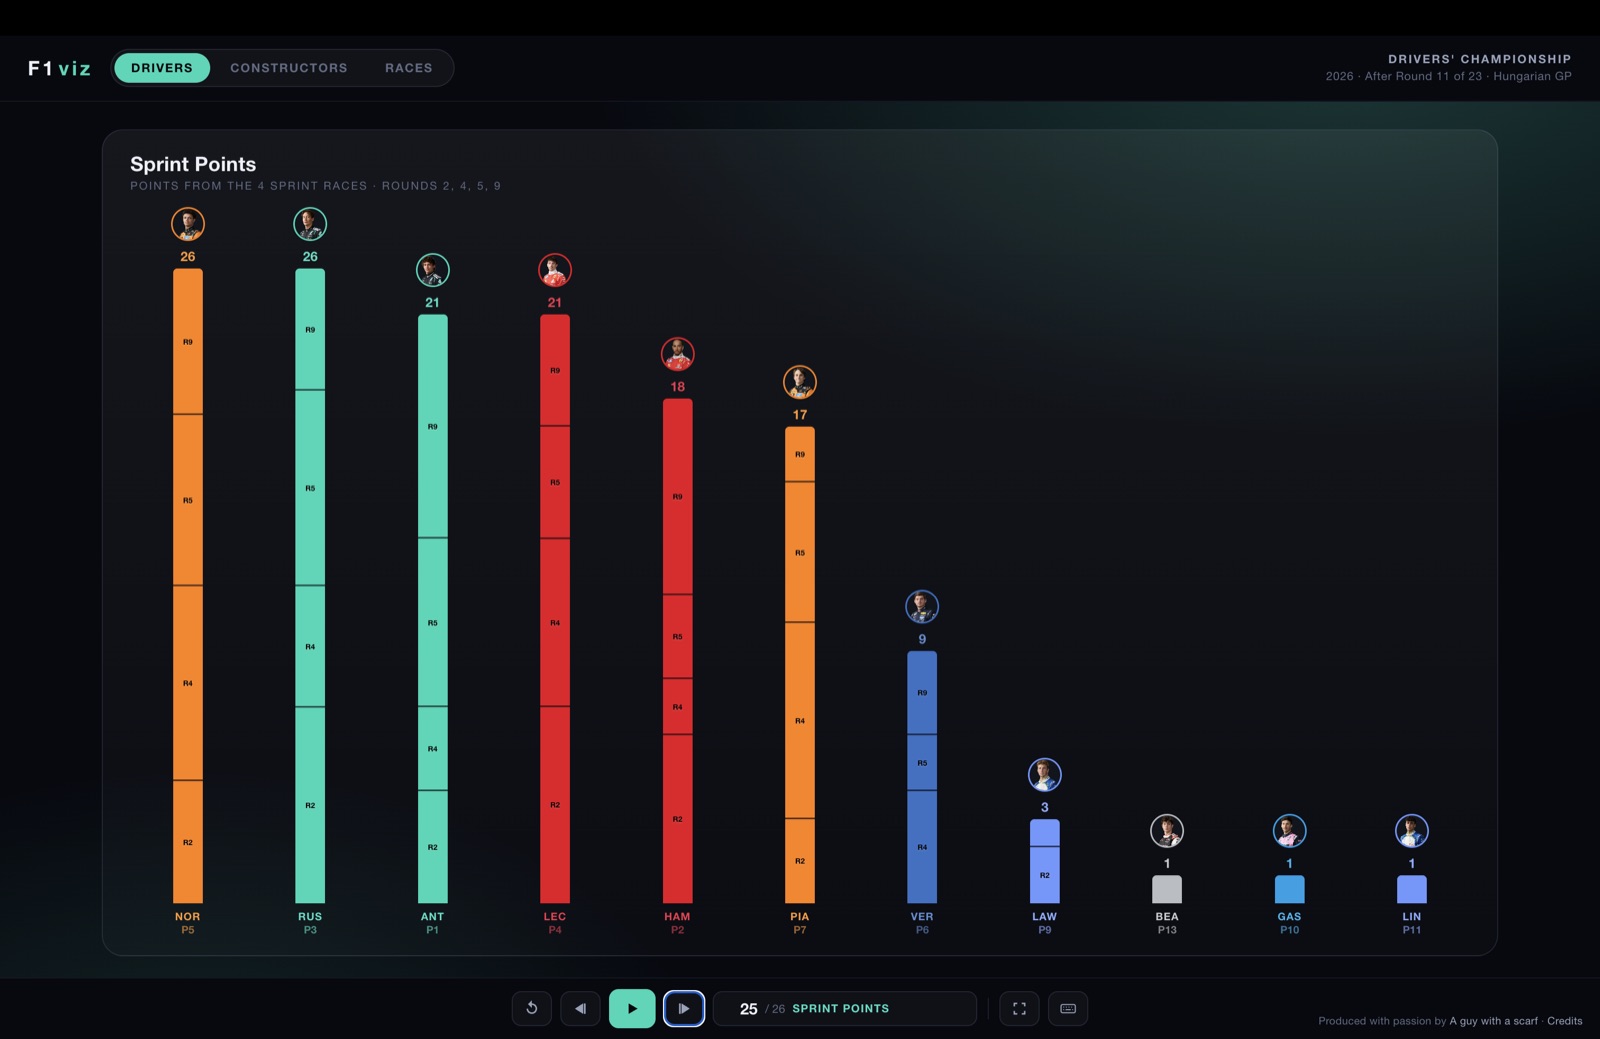
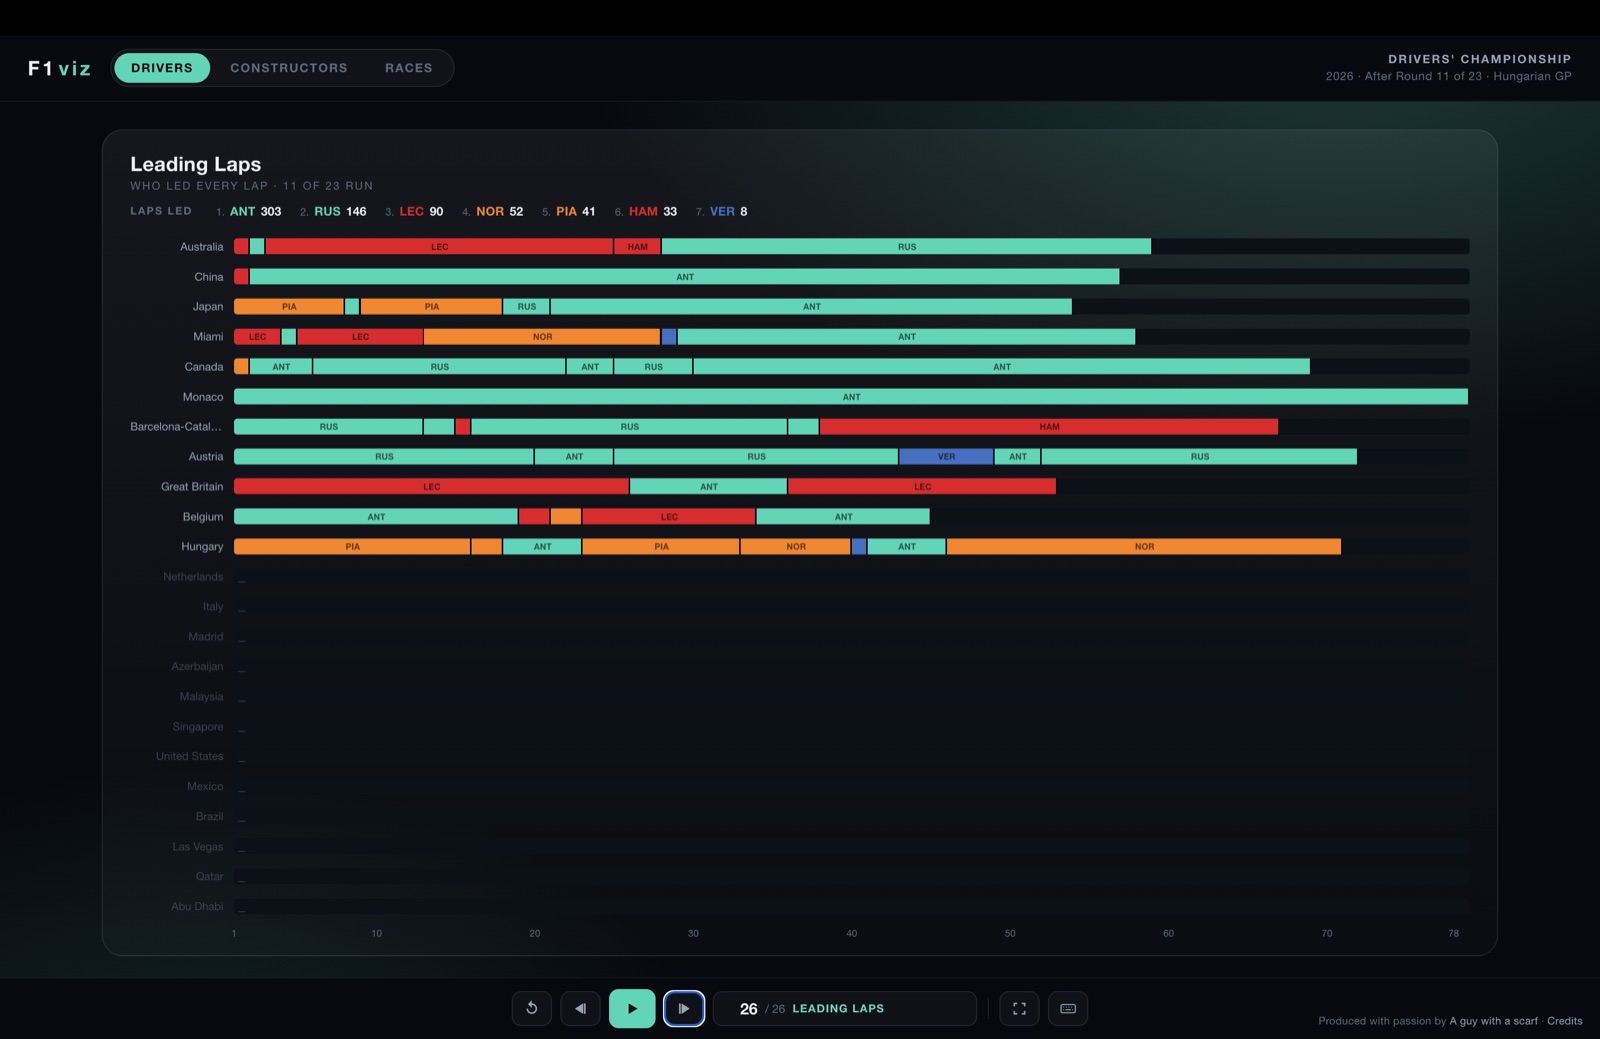
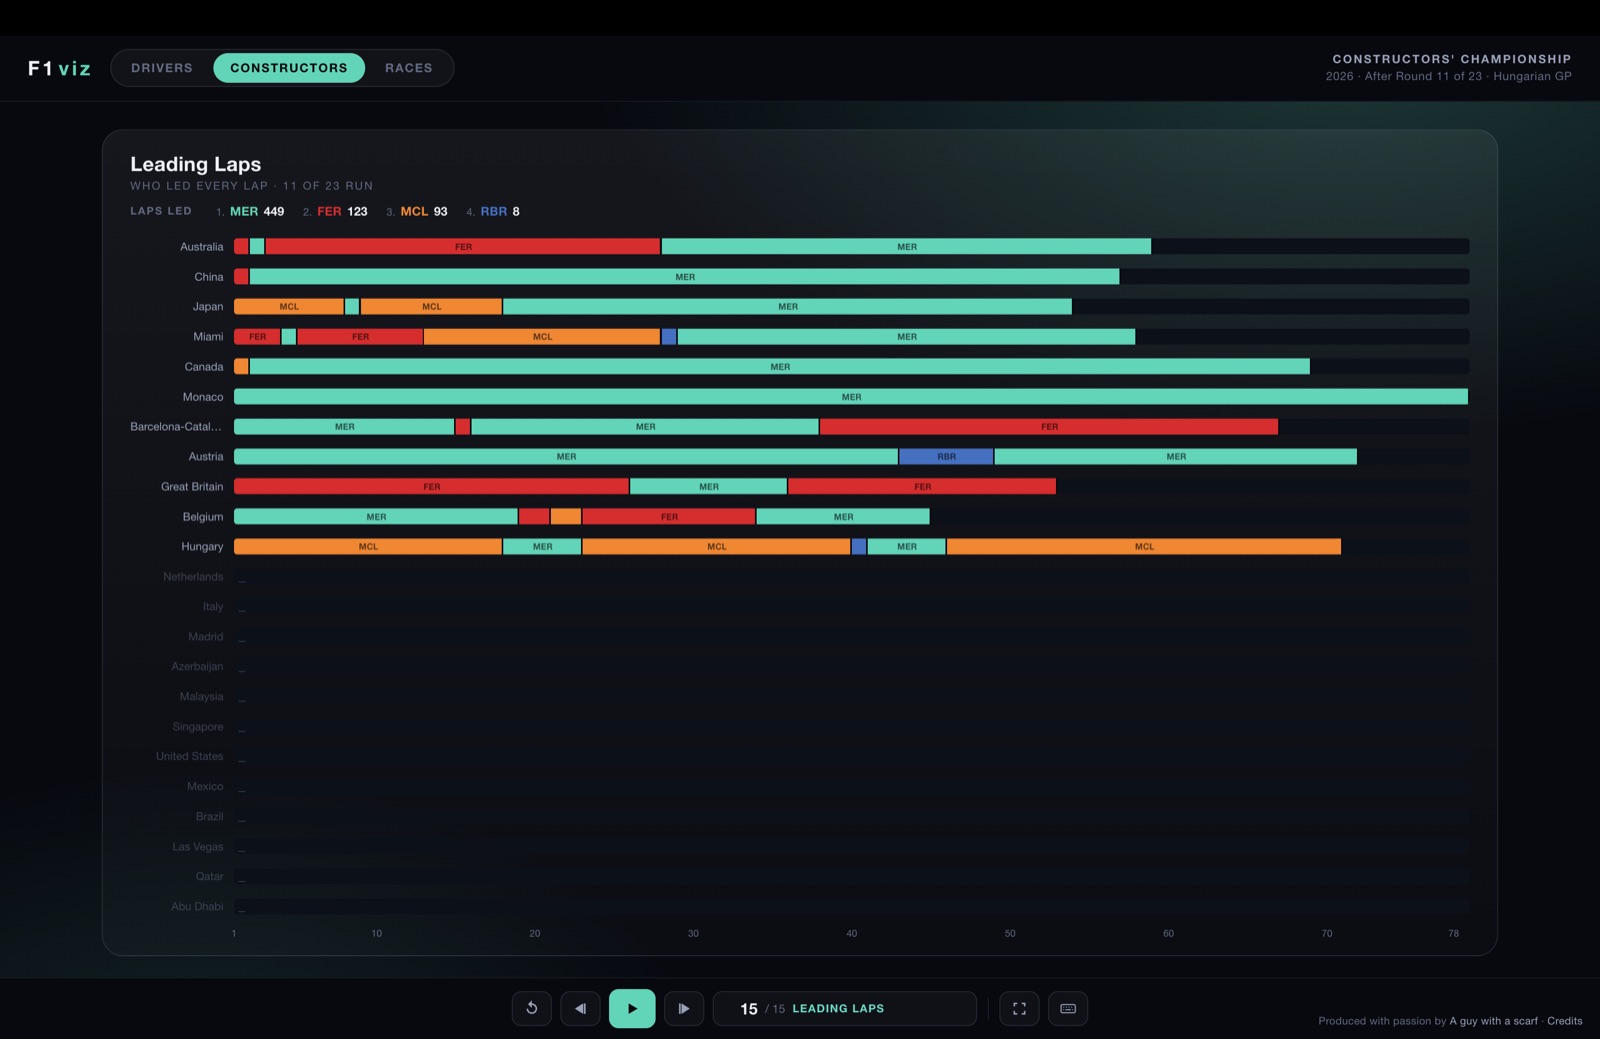
Sprint points — points from the sprint races only, round by round.Leading laps — who led every lap of every Grand Prix, one row per race on a shared lap axis, with a laps-led ranking.
06 · The Constructors film
Both cars, together
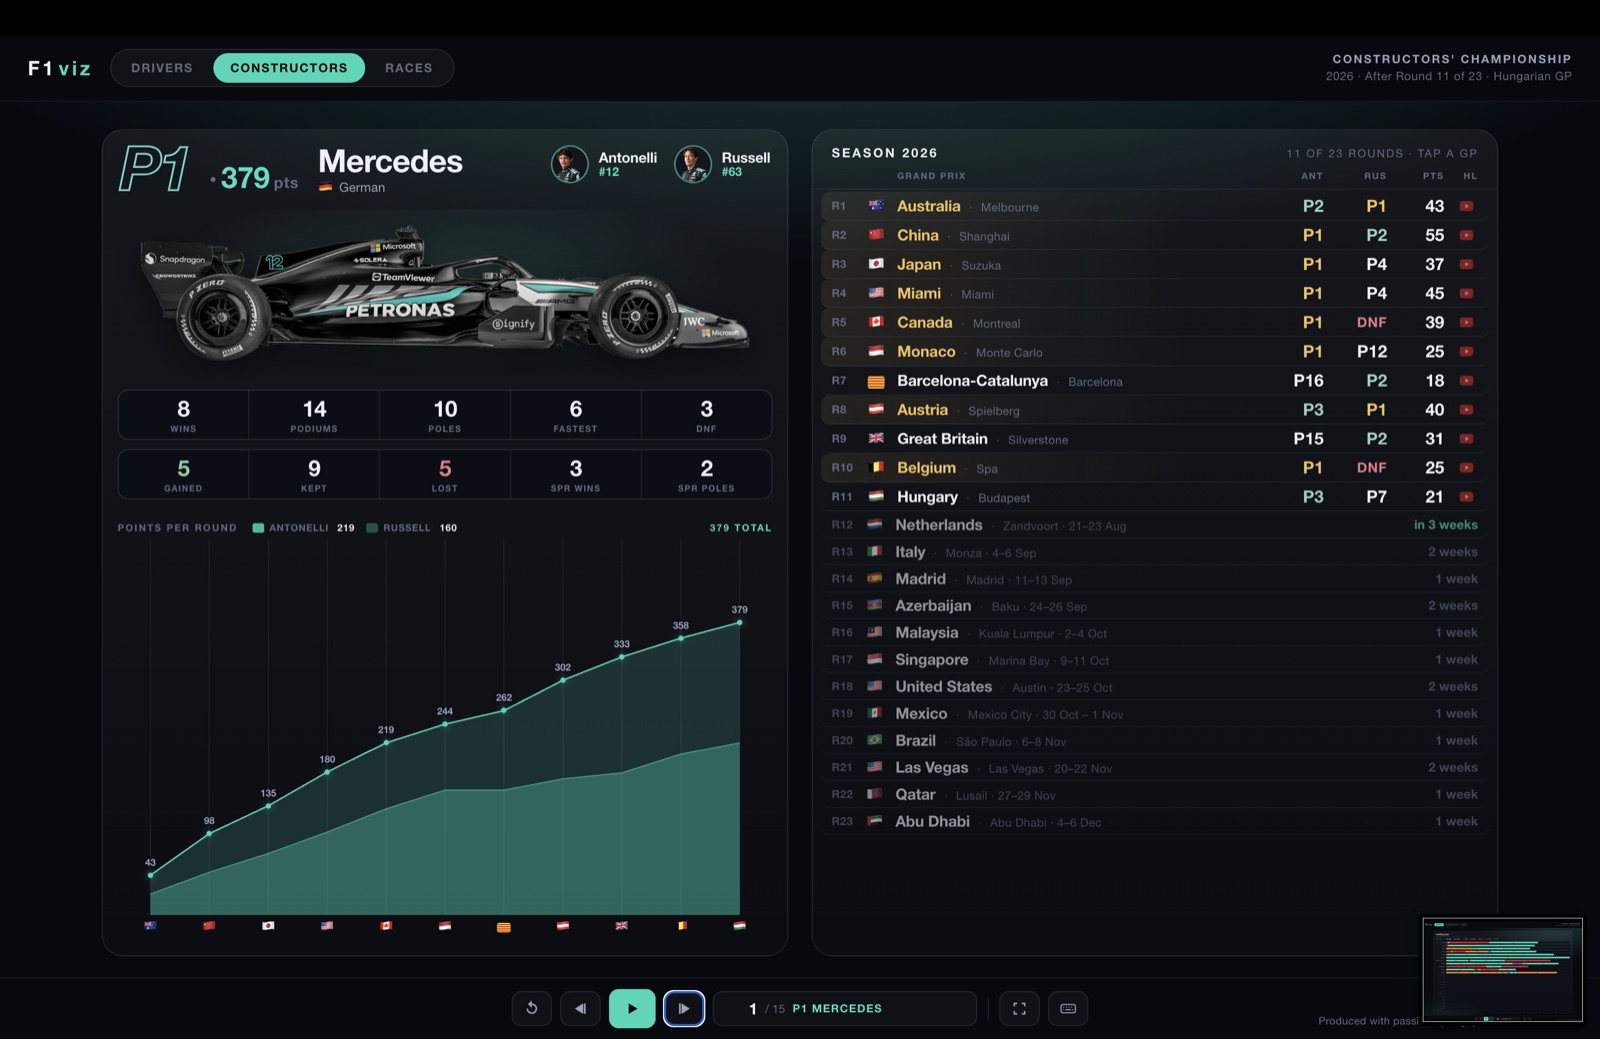
The Constructors film mirrors the Drivers one, but per team — the card shows the car, both drivers, and their combined season.
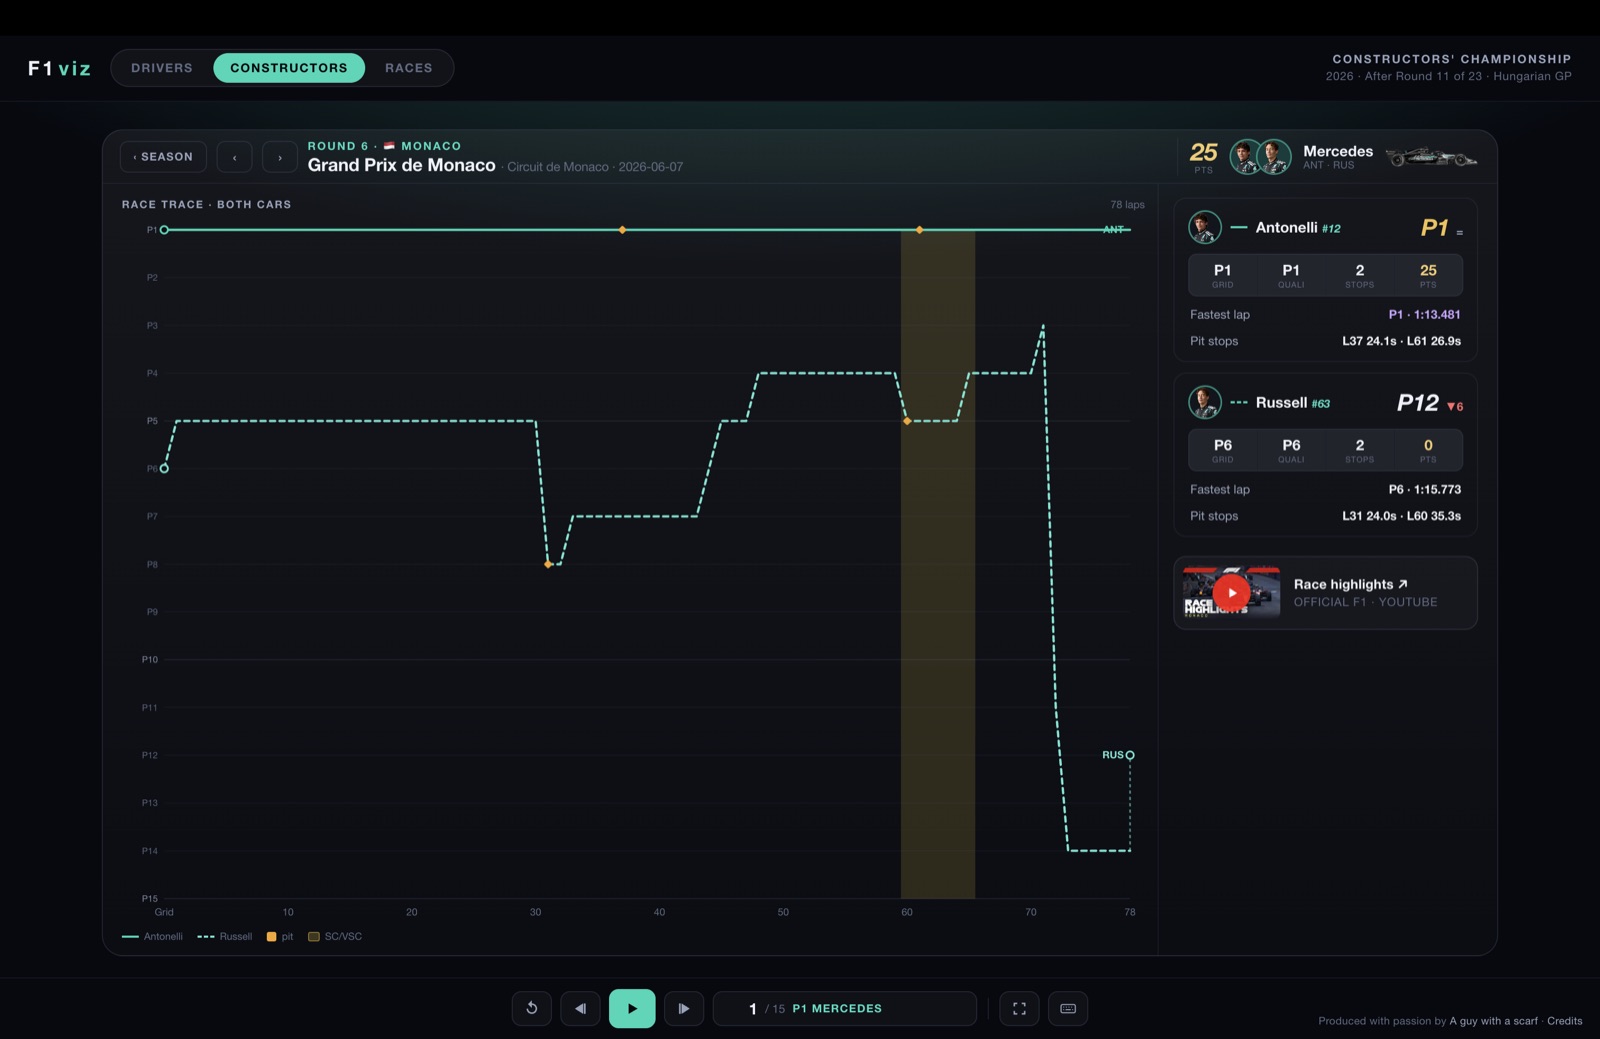
The team card: car, both drivers, combined points (each driver's share stacked), and every round's result for both cars.The race deep-dive plots both cars at once — one solid line, one dashed — with a result box for each driver.
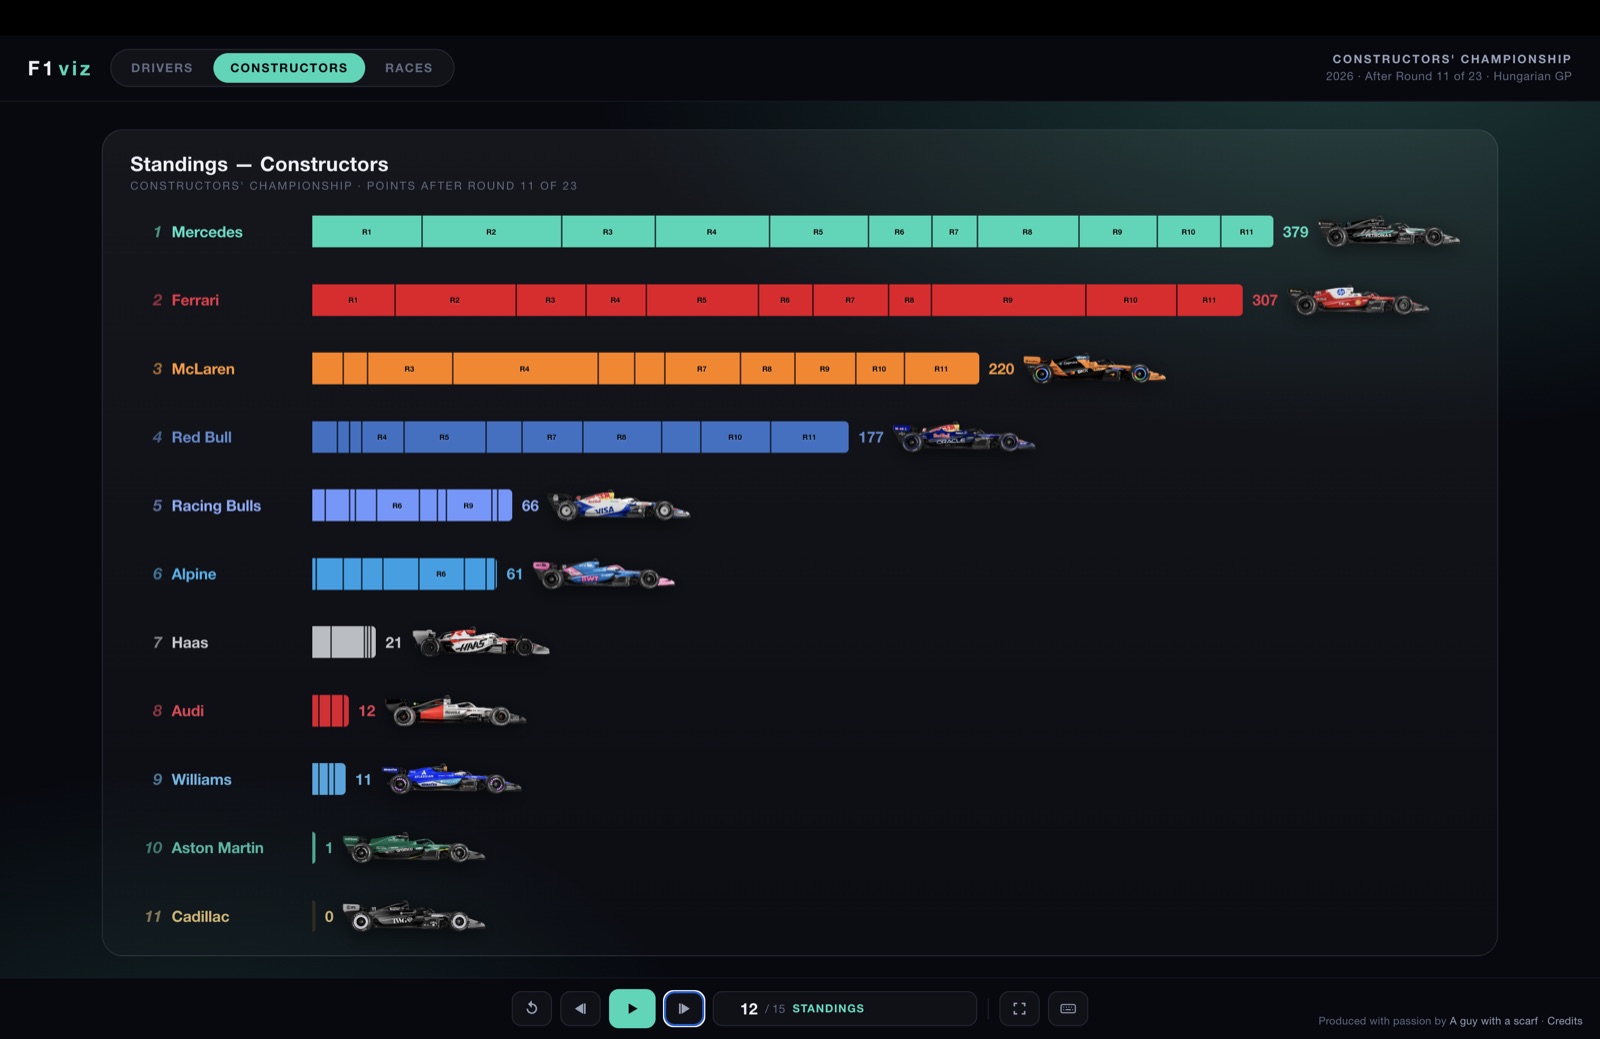
The same closing cards follow — Standings, Laps completed, Sprint points and Leading laps — grouped by team (teammate stints merge into one team colour).
Constructor standings — horizontal bars with each car's livery.Leading laps by team — MER · FER · MCL · RBR through the season.
07 · The Races film
Every Grand Prix, replayed
The Races film is one card per round. The left is the circuit and the facts; the right is the classification — and a play-along replay.
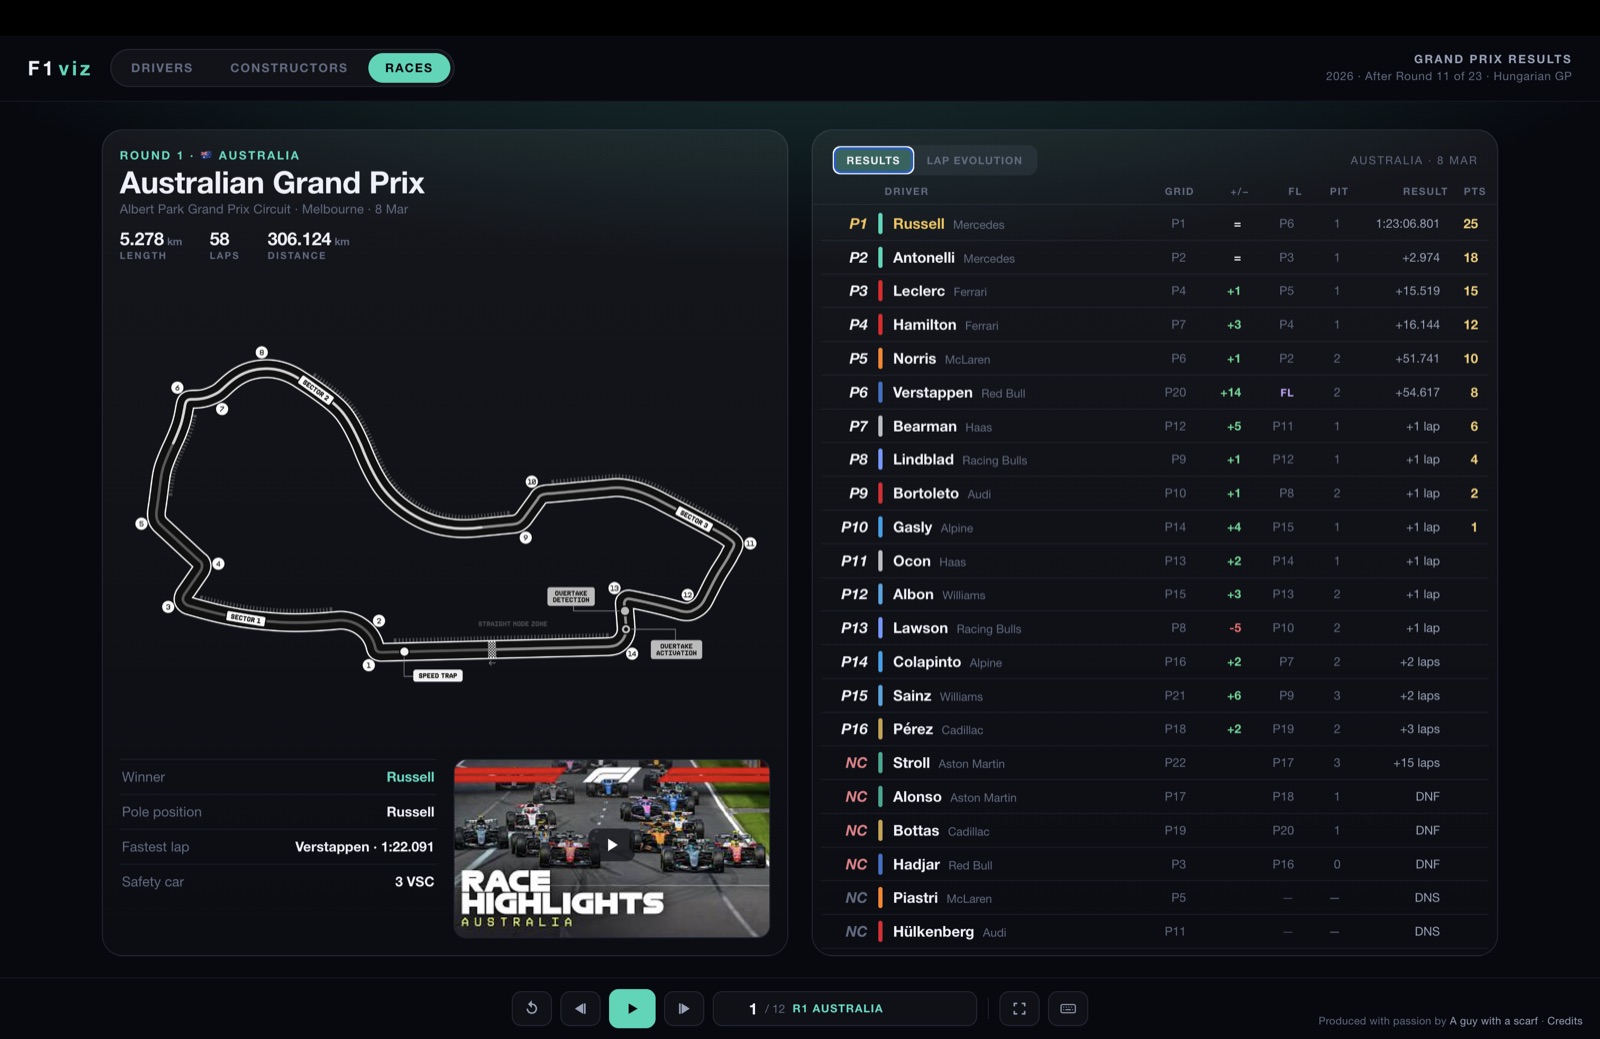
The Results tab: circuit map, race distance, winner · pole · fastest lap · safety-car count, official highlights, and the full finishing order (grid, positions gained, fastest lap, pit stops, gap, points).
Lap Evolution — the timing tower
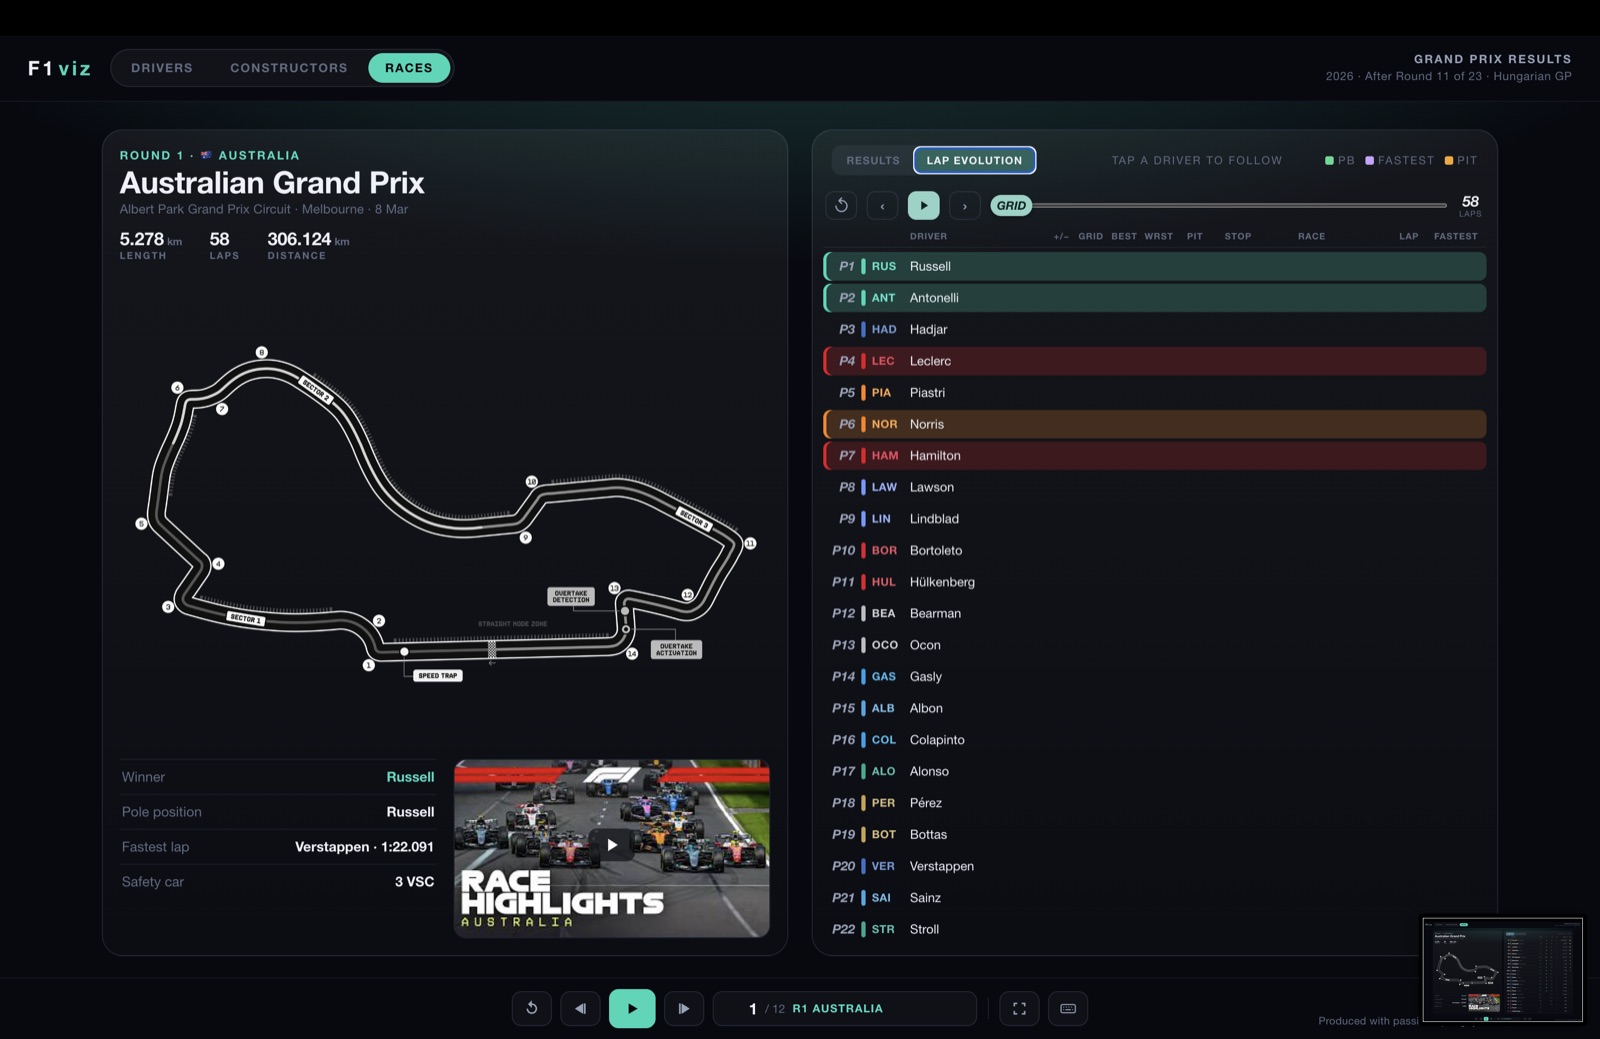
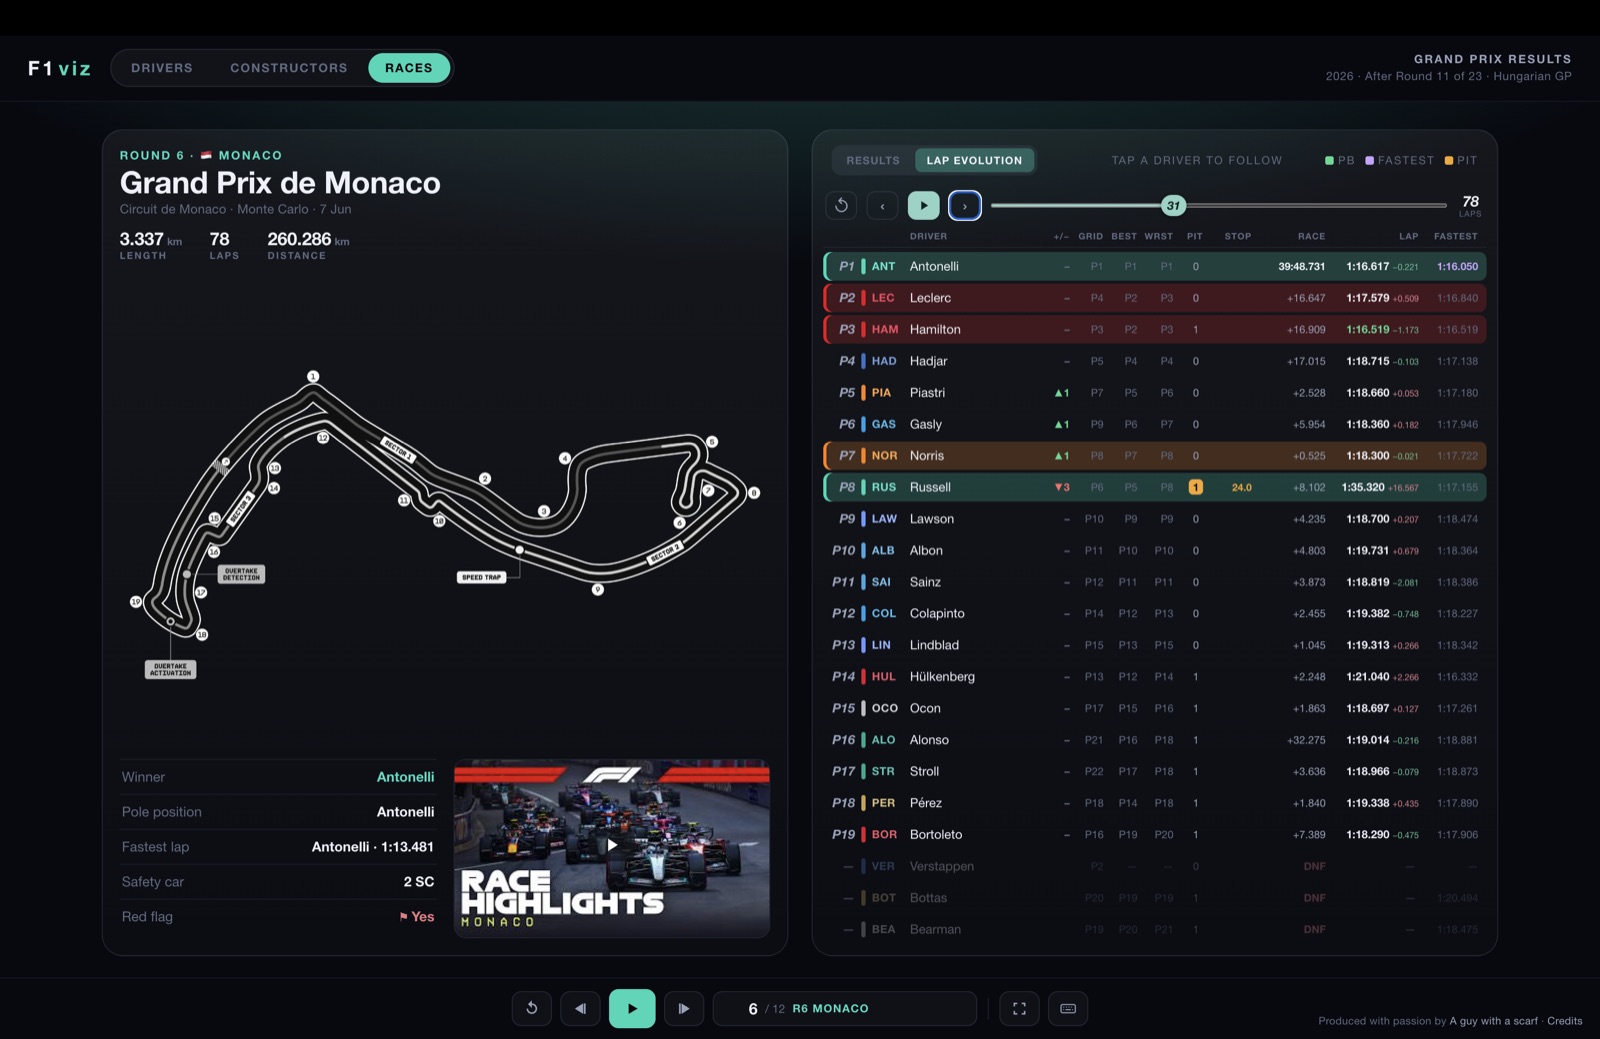
Switch to the Lap Evolution tab for a self-playing timing tower. Press play and the order rearranges lap by lap; scrub the lap slider to any point; tap a driver to follow them up and down the order.
At the grid, before lights out.Mid-race — live gaps and lap times, with pit stops (amber), personal bests (green) and the fastest lap (purple) highlighted as they happen.
The season map
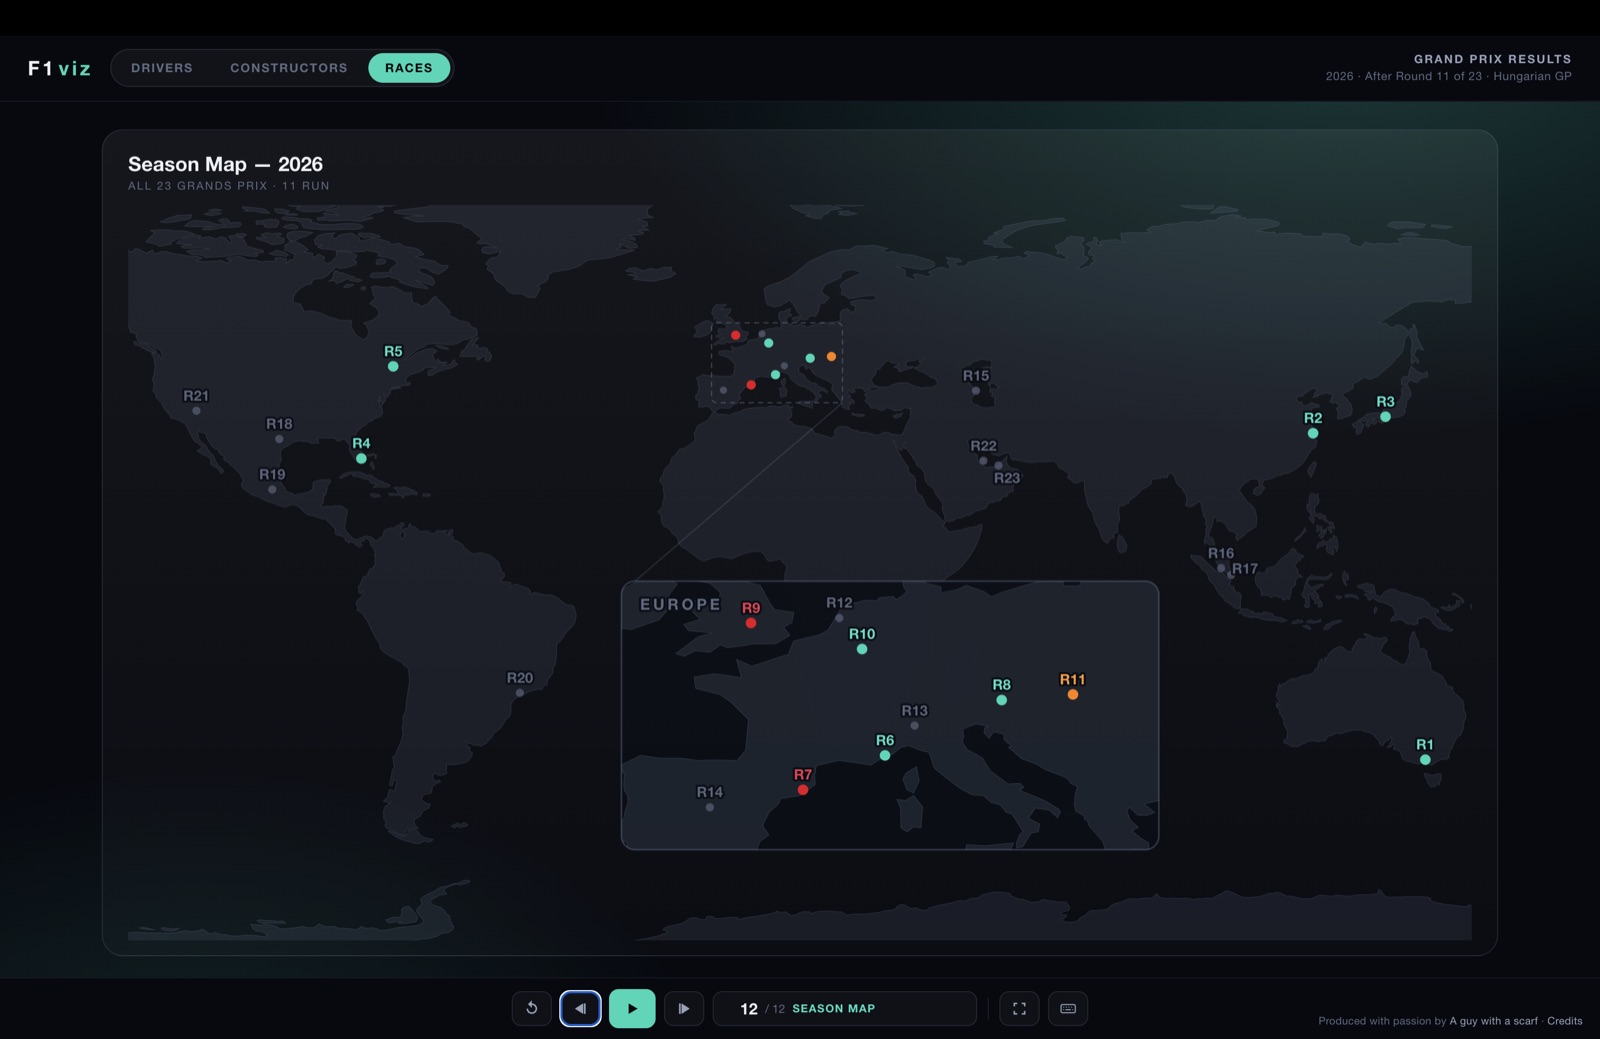
The film closes on the Season map — all 23 Grands Prix on the globe (with a Europe inset), each dot coloured by the winning team; upcoming rounds sit greyed out.
08 · Tips & sharing
Get the most out of it
Jump anywhere — click the counter in the control bar for a grid of every card in the film.
Present it — go fullscreen and hit play to let a film run itself.
Share a link — the address bar tracks exactly where you are (driver, race and chart tab), so a copied link reopens the very same view.
Compare tabs — Position, Lap times and the two Gap views describe the same race; flicking between them is the fastest way to understand what happened.
Where the numbers come from. Results, classifications, pit data, circuit maps and highlights are from Formula 1. Lap-by-lap timing and positions come from jolpica-f1 (the community Ergast successor); Safety-Car & VSC data from OpenF1. Everything here is used only to power this fan experience — the credit belongs to the rights-holders.
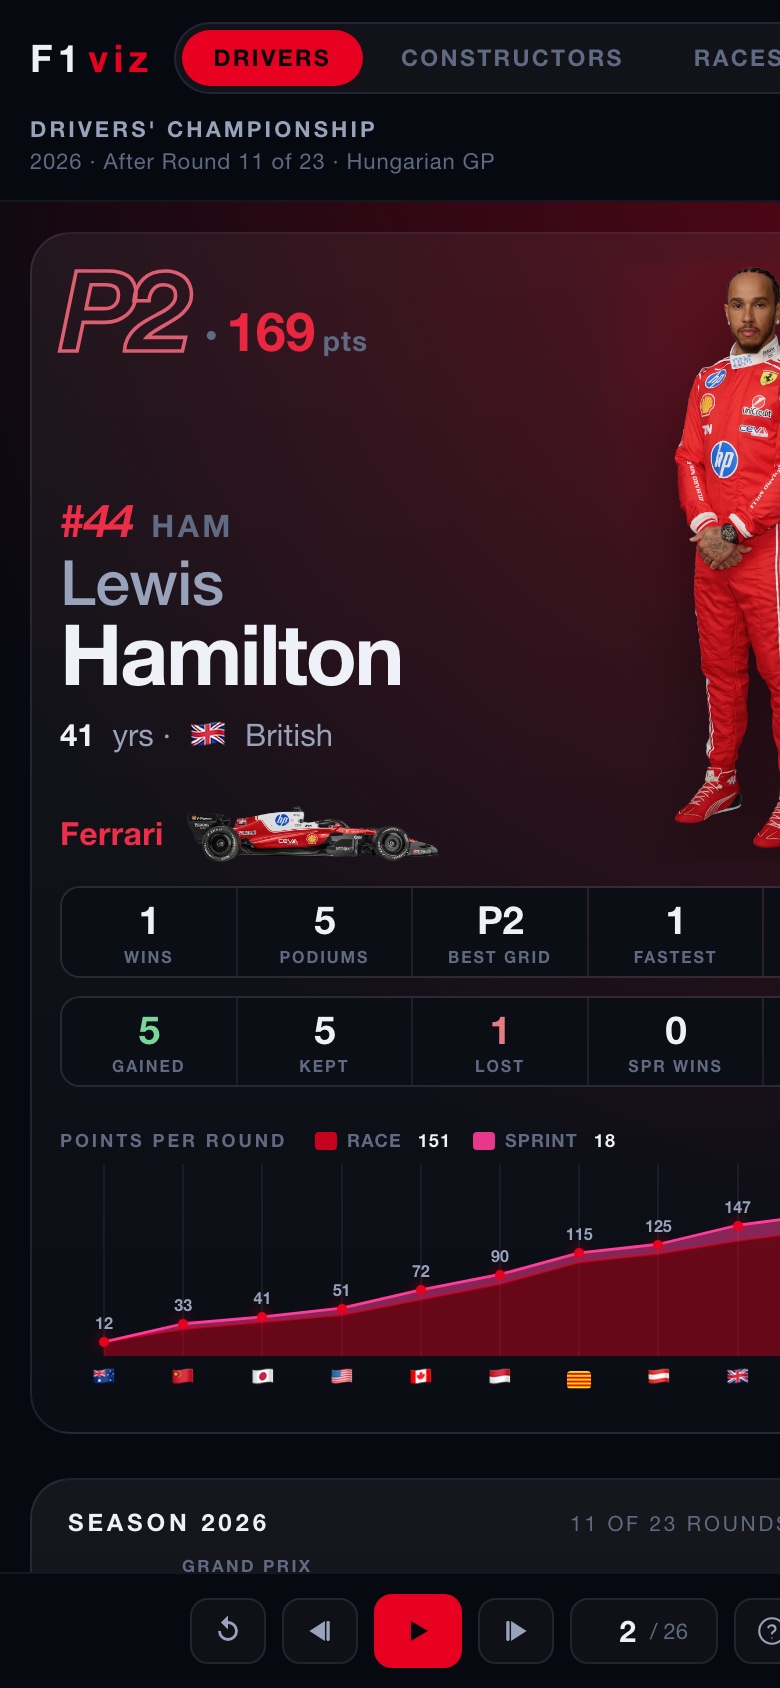
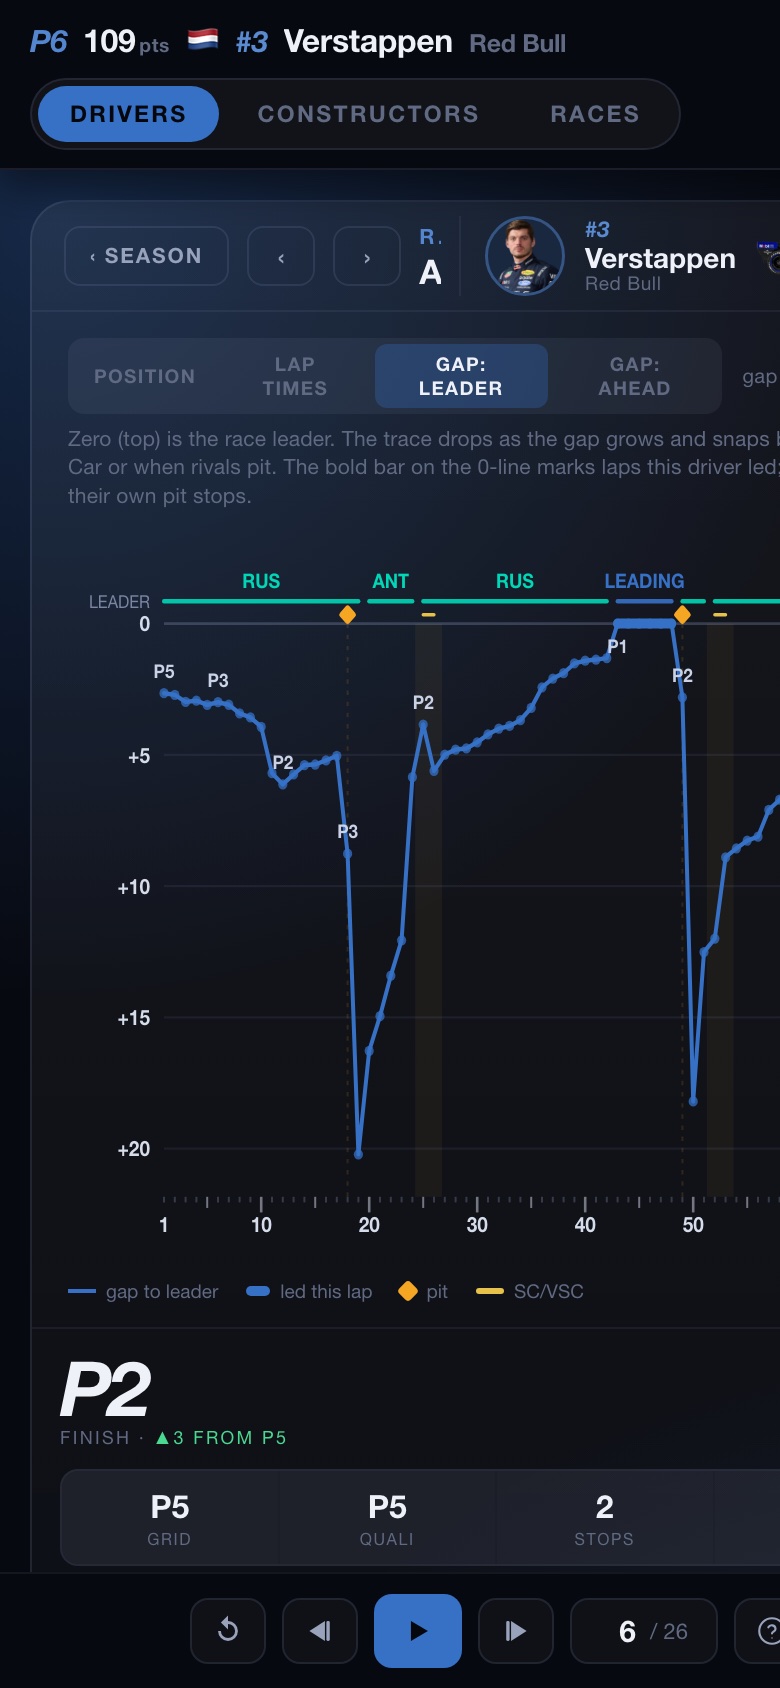
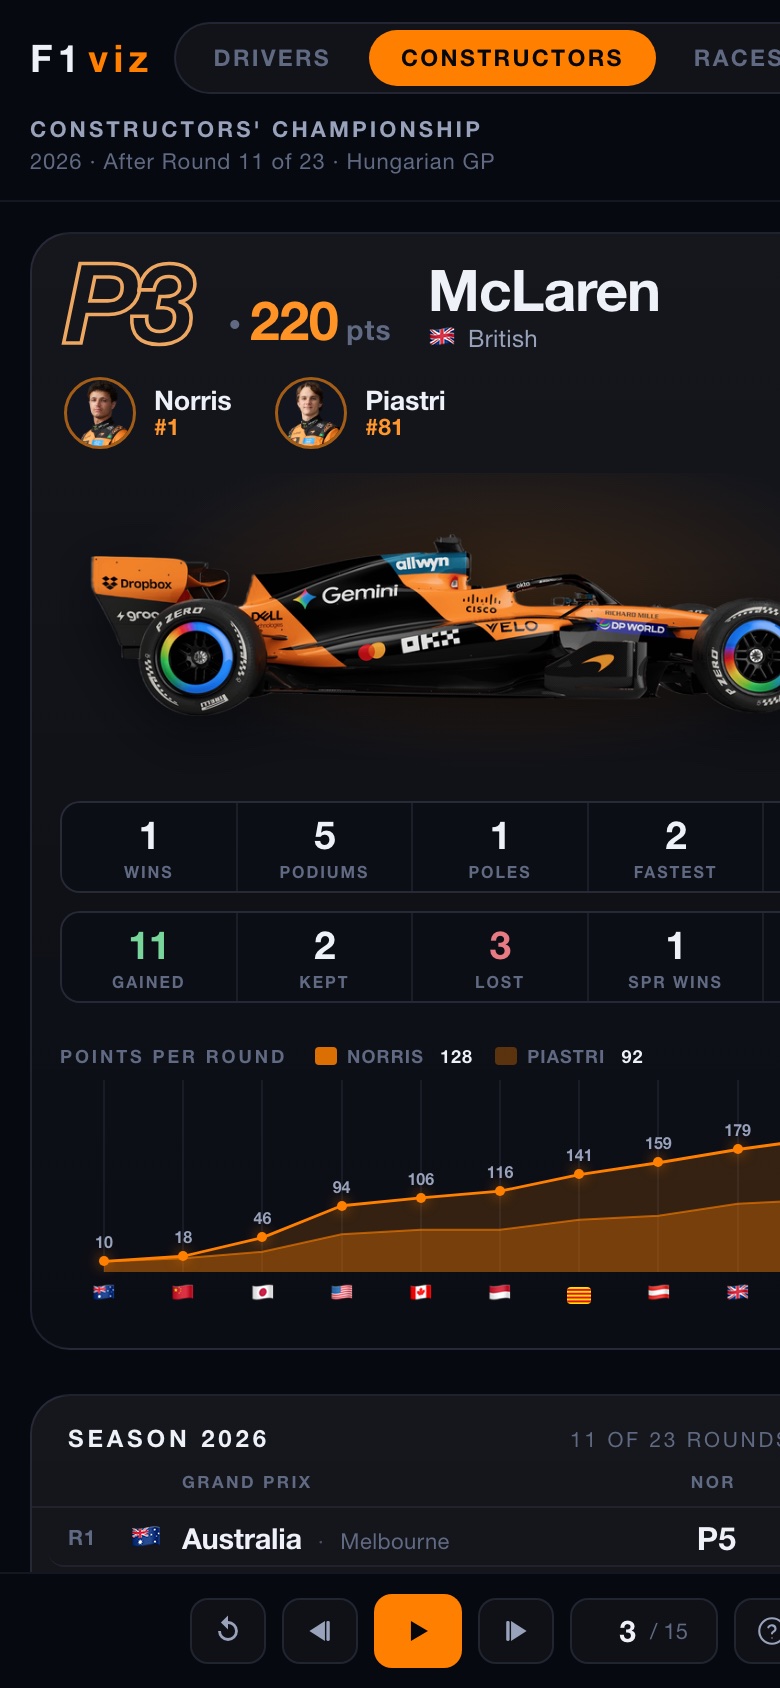
F1viz is really made for a wide screen, but it doesn't leave your phone behind. Everything reflows into a single tall column — the same cards, the same charts, just stacked. Swipe left/right through a film, tap a Grand Prix to open a race, and scroll to read the rest of a card.
A driver card — Hamilton, in Ferrari red.A race deep-dive — Verstappen's gap to the leader; the chart on top, the result below.A team card — McLaren, both cars together.